The Amazing OSM Community, and the Tasking Server, Maps Swaziland
Posted: November 10th, 2011 | Author: mikel | Filed under: mics, openstreetmap, swaziland, tech | Leave a comment »One month ago, I asked what to do with 10 million GPS points, and it turns out one awesome answer is map an entire country.
I wanted to experiment with the new HOT Tasking Server, so I set up a task using the Swaziland GPS tiles, but I didn’t bother to promote the effort at all. One month later, and the task is 100% complete, and about 25% verified. Amazing work by the community, and a quickly proven, easy to use, compelling tool.
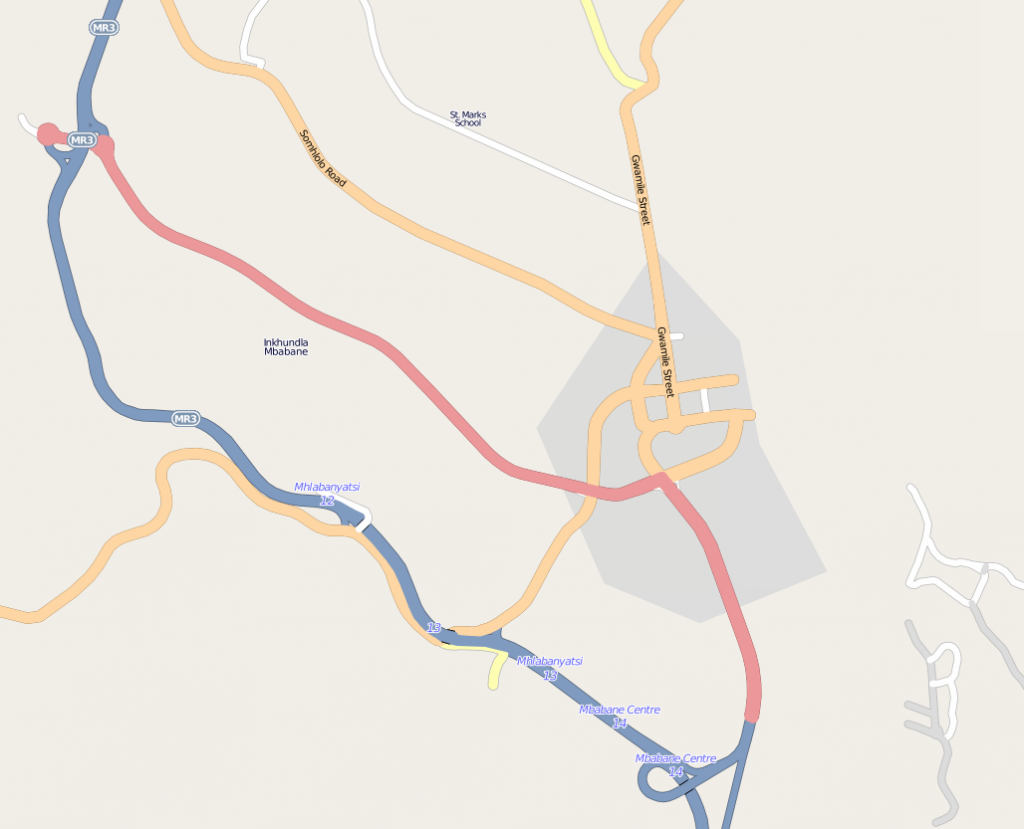
Here’s Mbabane, the capital of Swaziland, before the editing.
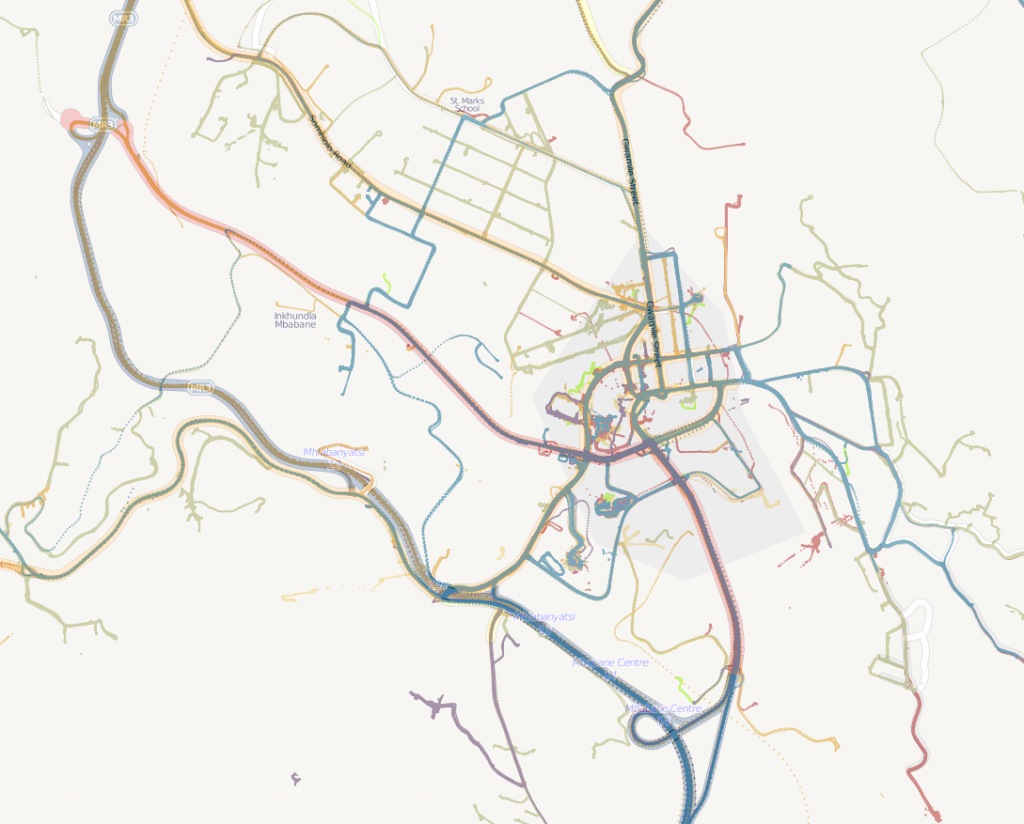
And here are the GPS traces of Mbabane, today.
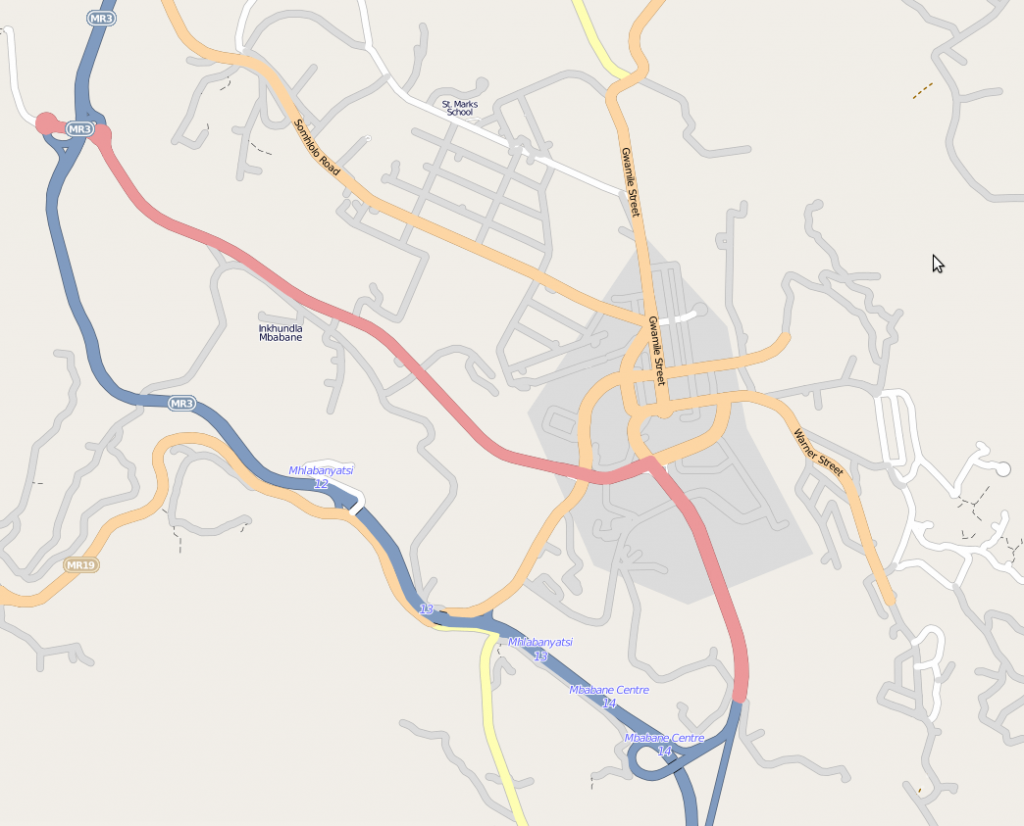
And finally, the map today.
New roads have been filled in throughout the country. It would be interesting to calculate the growth in road features over this month.
There are still lots to do. There are gaps in the GPS coverage, and Bing might help. This was only roads, and unnamed, unclassified roads at that. It’s really now up to the small and growing community of mappers in Swaziland to bring the map alive.
I asked some of the incredible top contributors about why they took part in the mapping, and how the tasking server helped out.
The tasking tool is really nice to keep the motivation up and to keep track of what’s already done. You see the progress and the small chunks are mostly manageable.
It is good for my inner self. It is rewarding on both a greater scale (creating a needed map) as well as a smaller scale. Also, I find tracing a very relaxing activity that leaves my analytical programmer’s mind open for podcasting, talking or just recuperating from the day.
It was a chance to contribute to a very underdeveloped part of the map and make a real difference to what was available in that country. This is also a country that would take a long time to reach a critical mass of roads without outside work. Hopefully this will give a base for people when they look at a rendered map, which in turn might encourage other people in/near Swaziland to fill in the gaps.
I like mapping because you get to look at somewhere in more detail than you normally would. I now have a real feeling for the geography of Swaziland.
I’ve been interested in HOT for a while and participate when I can, but it’s not always clear how to contribute. The task manager made that easy. To the larger question of why do this at all: it’s like knitting a sweater for millions of people at once.
I think it’s important to get the tile size right. For the Swaziland tracing, it was perfect. I peeked at another task (tracing buildings in Indonesia) and a single tile was too overwhelming.
stethoscope’s insight on the right tile size was among many great points of feedback. We’re learning lots about how to improve the experience of the tasking server even more, that’s getting captured in issue requests, and Pierre continues to push development.
It was after Haiti that this idea began brewing, with identified need for “Mechanical turk style process for working through and importing individual features from large imports” and “Tools for ongoing coordination and identifying needs, addressing the problem of what to map now?”. And really, it goes back to the search for Jim Gray. At my talk at Microsoft last weekend, I was fortunate enough to meet some of the team who worked on the first mechanical turk process for collaborative imagery interpretation … the inspiration has results!
What to do with 10 million GPS points?
Posted: October 3rd, 2011 | Author: mikel | Filed under: mics, openstreetmap, swaziland, tech | Leave a comment »10876681 to be exact. Recording once per second over 4+ months, eight GPS units were taken over every road in Swaziland (background on this survey). If not for some mishaps with batteries and missing SD cards, etc, the count would likely be double that.
Under the project description, the guidance had a lot of freedom for working with the GPS data: “Develop simple software demo interface, incl. analytical tools and manual for monitoring fuel consumption in household surveys.”. (In other words, do cool stuff). After some experimentation, we decided to go with three demonstrations: animation of the traces, tiles for use in OpenStreetMap data collection, and fuel consumption estimate plugin in JOSM. All the code is up on GitHub.
Visualization has always been an inspirational tool for data collection and holistic comprehension, especially in OpenStreetMap. Tom’s animation of London GPS tracks in 2005 is still inspirational, and more recently, ITO’s visualization of edits following the Haiti quake. I’ve used party render many times to animate traces during a mapping party, like this one in Mumbai, and experimented with different styles, like at Yuri’s Night.
The challenge here was to make a visualization on such a large number of points. Split up the task into processing and loading the GPX files into a PostGIS database, and then producing frames of an animation from the db. Having the database would also allow production of other products, like tiles. This set of scripts processes directories full of GPX; change the paths depending on your layout.
Thought about experimenting with SpatiaLite or ElasticSearch too, but that will wait for another time. libcinder would be an amazing platform to try, once geo support is in place.
The animation scripts generate a series of images using Mapnik, time slices from the db, and then the frames are assembled using a series of ImageMagick compositions and effects, and then the frames are combined into a movie using ffmpeg.
The result pretty clearly show the progress of each survey team over the months, with Swaziland as a whole emerging by the end. If there had been more time, would have experimented with more dramatic effects, movement of the camera view, music.
Tiles allow for careful exploration of this large data set. This map has shows all 10 million points rendered together. You can notice that a large number of the GPS traces cover new ground for OSM, so can be used as a tracing source for OSM. Typically in OSM, GPS traces are uploaded/downloaded for tracing, but with the high volume of points, it’s just not practical. The number of points over a particular segment of road gives some sense of its “importance” and “classification” (more used, more likely a major road).The tiles can be configured for use in tracing in Potlatch (http://rockburger.com/mics/tiles/!/!/!.png) and in JOSM (http://rockburger.com/mics/tiles/{zoom}/{x}/{y}.png).
Tiles were again generated using a modified Mapnik script. I experimented with the style and colors using TileMill, by converting a sample of the GPS data into a Shapefile (as of last week, TileMill now has PostGIS support), and converting the carto style sheet into a mapnik config file (carto can just be run on the command line). TileMill doesn’t yet have direct tile output, and I just needed a directory of tile files.
For the gas monitoring application, decided to build it into a JOSM plugin, as it will run on all platforms and should already be part of the MICS GPS toolkit. Started from the ElevationProfile plugin which already generates some stats on GPX files. The modifications add a calculation of fuel usage, based on city and highway fuel consumption rates. The compiled plugin can be downloaded, and then installed in the plugins directory of your JOSM profile; in the Plugins panel of JOSM, simply activate the plugin.
There are lots of ways this can be improved in future applications. ElevationProfile only works on a single GPX file, while this should be adjusted to work on groupings. Additional statistics would be interesting: distance per day, distance average by hour of day, distance average by day of week, distance speed minute by minute; and aligning those stats to points on the map would give some metrics for classification of OSM roads. GPX tracks should have some preprocessing, to simplify and filter out bad readings. Other software to experiment with is Viking an open source, cross platform personal GPS data management tool, and TopCube, which builds desktop apps on node.js apps.
In all this was a lot of fun, opened up some fresh programming avenues for me for dealing with large volume geodata, and should inform further development for MICS.
Household Surveys and OpenStreetMap
Posted: September 29th, 2011 | Author: mikel | Filed under: mics, openstreetmap, swaziland | Leave a comment »Time to introduce our work last year in Swaziland with Unicef, integrating OpenStreetMap techniques into nationwide household surveys.
Way back in 2008, I met Bo Robert Pedersen on the beautiful UN Nairobi compound, to drink coffee and talk maps (without any inkling of what would be happening for in Kenya a year later). Andrew Turner and I were on our way to South Africa for FOSS4G, had scrambled to buy some GPS units a couple days before in NYC (yea 17th St Photo!), and were talking to nearly everyone we could find about maps. We were riding the success of Mapufacture’s acquisition, having a great time mapping in beautiful places, and had found Bo by looking at the most active OSM editors in Nairobi.
Bo just happened to be the regional coordinator for MICS4 (or Multi-Indicator Cluster Survey), an international household survey program coordinated by Unicef, and one of the world’s largest statistical data sources on household demographics and living conditions, and women’s and children’s health and threats to their well-being. These surveys employed GPS units in a fairly simple way, for each survey team to record the central location of survey clusters, and Bo saw an opportunity to make much greater use of GPS. These surveys traverse literally every single road in the country, and simply collecting GPS tracks would unleash a treasure of track points for tracing in OpenStreetMap. And that was simply the tip of the iceberg.
Over the next year and a half, the ideas bubbled, and while in the midst of Map Kibera, we were given an opportunity to pilot these ideas in Swaziland. We designed a pilot project to develop a GPS training program for the MICS survey teams, collect and analyse and trace GPS traces, and explore innovative applications of the tools. Primoz Kovacic and I travelled to Swaziland, developed manuals, and did our best to get the crew psyched for mapping. Traditional household surveys and OpenStreetMap share a lot in common in technique and activity, but differ widely in approach. Surveys are highly controlled, top-down, and jobs, while OSM is self motivated, bottom up, and voluntary, and the interaction between the two was fascinating, especially in comparison to the ongoing work of Map Kibera. One of the first key things was a set of manuals for the MICS program, which are shared here CC-by-SA. The GPS Coordinator Manual may particularly be of wider use, at it describes precisely how to configure Garmin GPS units for surveying with OpenStreetMap.
In the next few blog posts, I’ll present the results, explore the technical experiments with the resulting data, speculate on other applications and approaches, and make available to the OSM community this treasure of data for tracing in the map.
OpenStreetMap and Transport, presentation to the World Bank Transport Forum
Posted: March 31st, 2011 | Author: mikel | Filed under: openstreetmap | Leave a comment »Kate Chapman and I were invited to speak at the World Bank Transport Forum, on OpenStreetMap and Transport and ICT … which is great, cause I’m a transport geek (honestly disappointed I missed an earlier session on “Best Practices in Railways”), a long time bicycle advocate (what after yesterday I know as “non-motorized transport”), and there’s many many cool projects in OpenStreetMap.
I gave this presentation, with kudos to osm-talk for pitching in.
Went over pretty well, despite being introduced as an anarchist. Actually, it went really well, and I have a stack of biz cards to follow up on at the World Bank.
My fellow panelists were Eddie from OpenGeo, talking particularly about their work with TriMet and Jon from Ushahidi, talking a bit about an interesting upcoming bicycle project in China. New to us was Todos Somos Dateros, a really interesting citizen engagement in Lima around transport data and feedback, with an overlapping approach to some parts of Map Kibera.
The other half of the day was also at the World Bank, at ICT Days. The session I caught featured guys from Data.gov, data.worldbank.org, Sunshine Foundation, government guys from Singapore and Korea. The key takeaway for me … its a small step for capable governments to open data, but to become open governments means true participation, and that’s not something government can ever do alone, except in the already most responsive and representative governments. For us, that means community technology development, to strengthen citizens and civil society.
Finally, of course the Bank had nice Wine and Cheese. Heard there about an upcoming Water Hackaton back in Nairobi, which fits nicely with ongoing work in Mathare, and older projects like WaterWiki.


