
Let’s Build the Global Goals Data Census
Posted: October 5th, 2015 | Author: mikel | Filed under: global-goals | 1 Comment »The Global Goals have launched and data is a big part of the conversation. And now, we want to act … create and use data to measure and meet the goals. I’m presenting here a “sketch” of a way to track what data we have, what we can do with it, and what’s missing. It’s a Global Goals Data Census, a bit of working, forked code to iterate and advance, and raise a bunch of practical questions.
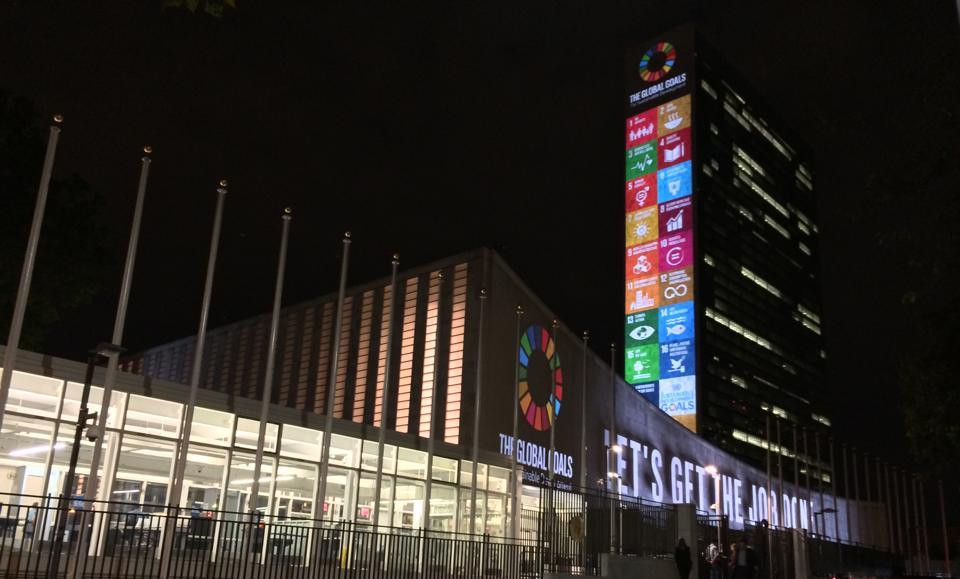
image by @jcrowley
The Global Partnership for Sustainable Development Data launched last week, to address the crisis of poor data to address the Goals. Included were U.S. Government commitments to ” Innovating with open geographic data”. In the run up, events contributed to building practical momentum, like Africa Open Data Conference, Con Datos, and especially the SDG Community Data Event here in DC, facilitated by the epic Allen Gunn. And the Solutions Summit gathered a huge number of ideas, many of which touch on data.
Among many interesting topics, the SDG Community Data Event developed many ideas and commitments, including
- Put all the data in one place
- Create an inventory of indicators: + What exists ; + What goals are they relevant for
- Build a global goals dashboard
The action of taking stock of what data we have, and what we need, looks like a perfect place to start.
Global Goals Data Census
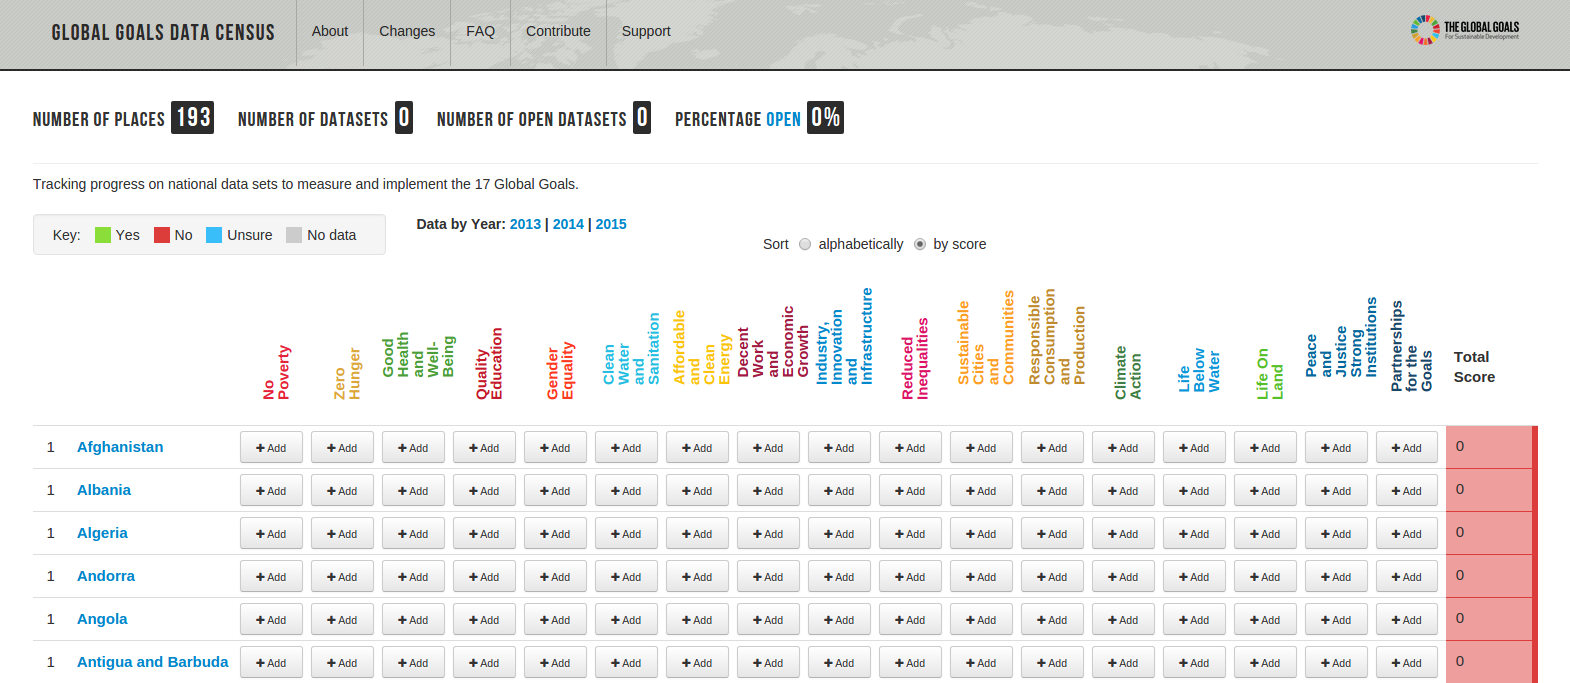
OKFN’s Open Data Census is a service/software/methodology for tracking the status of open data locally/regionally/globally. I forked the opendatacensus, got it running on our dev server, made a few presentation tweaks, and configured (all configuration is done via a Google Spreadsheet).
Each row of the Global Goals Data Census is a country, and each column is one of the 17 Goals. Each Goal links to a section of the SDGs Data, built off a machine readable listing of all the goals, targets and indicators.
This is truly a strawman, a quick iteration to get development going. It should work, so give it a quick test to help formulate thoughts for what’s next.
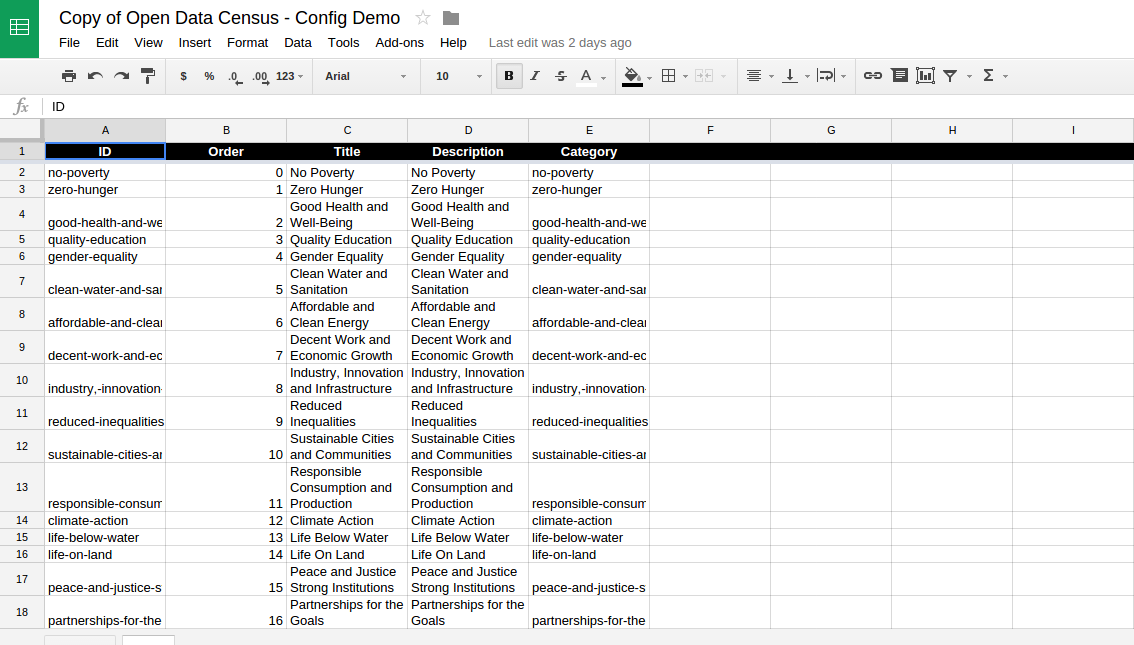
Global Goals Data Census Config
This exercise brought up a bunch of ideas and questions for me. Would love to discuss this with you.
- Does it make sense to track per Indicator, in addition to the overall Goal? There been a lot of work on Indicators, and they will be officially chosen next year.
- There may be multiple available Datasets per Goal of Indicator. The OpenDataCensus assumes only one Dataset per cell.
- For the Global Goals, are there non-open Datasets we should consider, due to legitimate reasons (like privacy).
- Besides tracking Datasets, we want to track the producers, users and associated organizations. The OpenDataCensus assume data is coming from one place (the responsible government entity). Much more complex landscape for the Goals.
- What is the overlap with the Global Open Data Index? Certainly the Goals overlap a little with the Datasets in the Global Census, but not completely. And the Index doesn’t cover every country that has signed up for the Goals. Something to definitely discuss more.
- Undertaking the Census, filling the cells, is the actual hard work. Who is motivated to take part, and how best to leverage related efforts.
- Many relevant data sets are global or regional in scope. How best to incorporate in a nationally focused census? How to fit in datasets like OpenStreetMap which are relevant to many Goals?
- There is an excellent line of discussion on sub-national data. There are also non-national entities which may want to track Goals separately. How to incorporate?
- What other kinds of questions do we want to ask about the Datasets, beyond how Open they are? Should we track things like the kind of data (geo, etc), the quality, the methodology, etc?
- Where could the Global Goals Data Census live? A good use of http://data.org/?
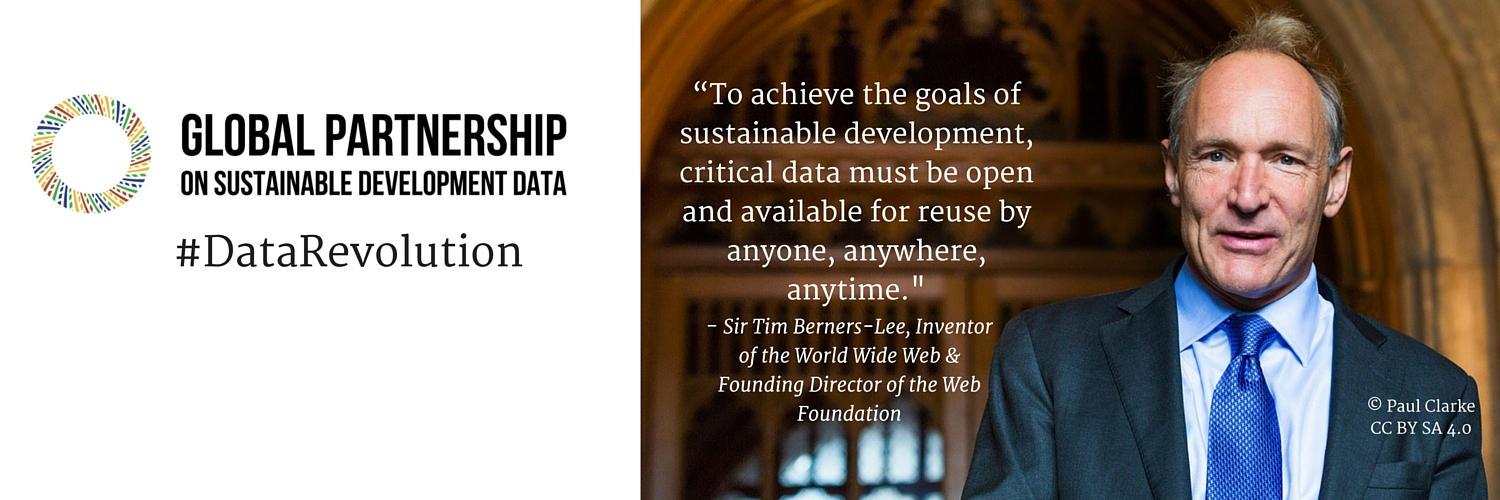
@webfoundation on open data and the SDGs
Does this interest you? Let’s find each other and keep going. Comment here, or file issues. One good upcoming opportunity is the Open Government Partnership Summit … will be a great time to focus and iterate on the Global Goals Data Census. There will be an effort to expand adoption of the Open Data Charter, “recognizing that to achieve the Global Goals, open data must be accessible, comparable and timely for anyone to reuse, anywhere and anytime”. I’ll be there with lots of mapping friends and ready to hack.
Open-Community-Collaborative Data for Land Rights and Tenure
Posted: March 25th, 2014 | Author: mikel | Filed under: events, talks | Leave a comment »Presenting today at 2014 Land and Poverty Conference
Open-Community-Collaborative Data for Land Rights and Tenure
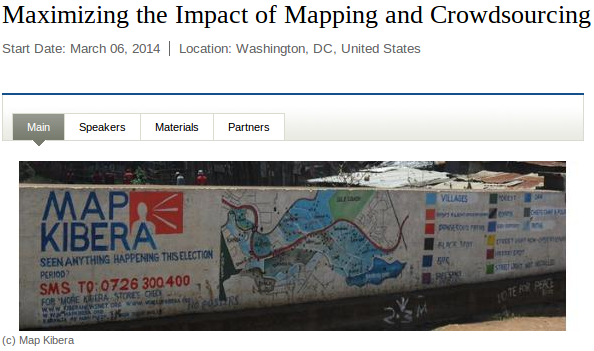
The generation, management, and distribution of land tenure and land rights spatial data is generally restricted in traditional closed information architectures, in part for legitimate legal and security reasons. However, the gap thus far in adoption of more innovative open data practices means a missed opportunity to address critical issues of accountability and access to land rights data for the most marginalized. Open data communities, such as the OpenStreetMap (OSM) project, have proven to be transformational collaboration platforms in domains like disaster response, and now several projects show promise for this open approach to land rights. This paper explores two distinct kinds of contribution from the OSM approach. Firstly examined is the direct use of OSM as a core engagement activity for advocacy, planning, and accountability by communities asserting their rights for representation and security. Lessons from projects in Kibera, Indonesia, East Jerusalem, and La Boquilla, Columbia are detailed. Secondly, OSM is looked at as a starting technical software base & community model for collaborative, open geographic data creation & sharing, forked (in the open source sense) for adaptation to the particular access rules and data structures required for land tenure registration.
OpenStreetMap is a free and open map database of the entire world, build from the active collaboration of tens of thousands of volunteers globally. It is sometimes called the “Wikipedia of Maps”, since contributing to OSM is open to absolutely everyone, and the data and code ecosystem are all in the commons, licensed for re-use and re-distribution. Such “crowd-sourced” initiatives have been held up to intense scrutiny, and have been found to meet or exceed the data quality of traditional sources, and are certainly more accessible. Thus, OSM has been adopted by companies, governments, universities, international organizations, and software developers. The domain of disaster response, particularly through the work of the Humanitarian OpenStreetMap Team (HOT), has been transformed by the practice of OSM, after the devastating 2010 Haiti earthquake, where OSM became the base map for the response. More recently, Typhoon Haiyan saw over 1000 contributors map millions of features and damage point, for use by organizations such as the American Red Cross, UNOCHA, MSF, the World Bank, and the New York Times.
In the first part, community mapping in OSM has proven a valuable supplement to official tenure process, or to help communities advance their rights agenda. A core principal of OSM is that the most accurate map will be made, with the right basic training, by people residing in a location, not necessarily survey and cartographic experts. This especially holds true in communities at risk of dispossession by authorities, where official maps may portray a geographic mis-reality more conducive to their plans, or the community itself may not be physically accessible and suspicious of outsiders. Take the Kibera slum of Nairobi, the object of many controversial upgrading and resettlement plans, was a blank spot on official maps, until the public infrastructure (including roads and paths, sanitation infrastructure, health services, etc) was mapped by Map Kibera in OSM. This project (and now organization) taught young residents the technology to make the map themselves, and represent their community. Being a completely open system, the goal was not to map private residences, but to make visible the community as a whole, and of particular interest here, track the events and reactions to upgrading programs. Spatial data is used as the context for citizen media, in the form of bloggers and videographers, who geolocate stories on the Voice of Kibera, an instance of the Ushahidi platform. Stories have covered demolitions in Soweto East, resettlement to the “decanting site”, and most recently efforts for the Nubian community (the original settlers of the slum) to gain title and recognition. The community, evidence based perspective, linked to specific locations, shared openly, both online and offline, has provided a much needed monitoring and accountability function in these contentious processes.
Another example is found in Indonesia, where HOT undertook a wide ranging effort to collect data in OSM for disaster preparedness risk models. This project involved training and connections with a large number of actors, from disaster preparedness agencies of the Indonesian government, to university students, to city officials, planting the seed of an open data community in Indonesia. As is often the case with open data, unexpected uses and connection arose, specifically with the ACCESS civil society strengthening program. Part of ACCESS activities involved “poverty mapping”, participatory mapping of community infrastructure and socio-economic data, a step to create community development plans. These poverty maps were created on paper in a facilitated process, and while quite detailed, beautiful and useful, the opportunity for re-use, analysis, and access to these maps were limited. HOT adapted the OSM workflow to these participatory processes, which allowed for better and easier data collection, and connection into a host of open source tools to visualize and analyse that data. A major change to OSM tools was made to handle private and secure data. While communities were comfortable sharing openly geographic data on community infrastructure, they did not want to share detailed socio-economic information. To accommodate that, the OSM editing tools were adapted to work with multiple databases, both the open, public database, as well as private database. This provides a means to selectively share community data, without invoking another tool.
In the second part, OSM is examined as both a technical and community starting point to open creation and sharing of tenure data. It’s entirely fair to say that OSM has been the most successful approach to collaborative geographic data ever. That’s due to some key decisions of the architecture, such as flexible tagging rather than rigid ontology, and transparent history of individual contributors. The software ecosystem is quite robust, including what might be the most user friendly map editing client developed, iD. The community approach is decentralized, distributed responsibility, yet quite unified through clear purpose. However, not all kinds of data are appropriate for OSM, as OSM focuses on visible infrastructure, land use, and some administrative boundaries, but by community convention, does not contain cadastre (among many other things). As well, OSM is completely open for anyone to edit, and that is simply not possible for land tenure data; there must be some process for validation and protection of submissions. There are other projects that have started with OSM architecture and principals, and adapted to a different database. For instance the USGS prototyped its use for the National Map; the Moabi project is deploying OSM architecture for collaboration on natural resource extraction data; and the before mentioned poverty mapping project in Indonesia. In order to support approaches like the Social Tenure Domain Model, there are very particular adaptation requirements to OSM. Access control to both data editing and data structures is required, and experiments show that OSM architecture is amenable to such changes. Just as crucial, OSM makes individual contributors visible, and relies on their participation, communication and collaboration. Despite the necessary institutional element of land tenure, a successful program must retain such individual empowerment.
Challenges of OpenStreetMap in Institutions
Posted: March 4th, 2014 | Author: mikel | Filed under: openstreetmap | Leave a comment »This Thursday, the World Bank will hold an event on how large organizations can better engage with projects that involve OpenStreetMap. That’s my take anyway! I’ll be part of a panel with good folks like Nithya Raman from Transparent Chennai and Rob Baker from, um, everything. I’m hoping this is a good chance to get some strong ideas percolating through the bureaucratic membranes. My slides are here. You should come and maximize with us! (storify stream of the event here)
Ahead of the event, I’m reflecting (rambling?) on what’s been challenging for me to bring OpenStreetMap, citizen journalism, and participatory technologies into the institutional context of large development organizations. This interests me because bringing together “community” and “authoritative” data and approaches will produce better results. I’m coming from the assumption that the methodologies of these tools in community development are pretty sound on their own, and we have good ways to continually improve what we do. The struggle I want to examine is the associated organizational change in large institutions. That’s where the gap in impact lies, not in anything fundamental in the methodologies.
The event came to be after I successfully bugged Stephen Davenport (who’s now at the World Bank) to publish a somewhat forgotten, but proven very useful, Draft HowTo Note on Community Mapping. I regularly included this document in a package to introduce our work to others (as well as the Case Study on Map Kibera and LearnOSM). And I soon learned the HowTo would be an independently published chapter. (It’s published, read it.) And we’d hold an event with smart and influential people (that means you).

Scaling Up? From http://www.flickr.com/photos/wlscience/3071678864/
So we are “maximizing” at the event. Or, let’s make it bigger. I’ve often been asked about scaling up community mapping. Like, it’s great that you mapped one neighborhood, now let’s do the entire city, the entire district, the country, 12 countries. It doesn’t work like that. Communities can’t be “industrialized”, but always take intensive engagement. That doesn’t mean that things can’t “grow” … they can very fast as evidenced by the OpenStreetMap community as a whole. But that networked growth occurs by building relationships at all scales, not simply multiplication. Still, if you want to map the 100 largest slums in the world, I do have a plan, it just won’t be a cookie cutter model.
There’s a big mismatch in time scale. Organizations work on project timelines and annual budget timelines. Notice the substantial increase in projects initiated late in the fiscal year. Projects end when they end. Communities don’t end. A thriving community of mappers takes way more time to develop than a project timeline, and especially with a real physical community, there are relationships and expectations that extend beyond the institutional structure. I don’t have a good answer for this, and I expect to see this completed solved on Thursday ;).
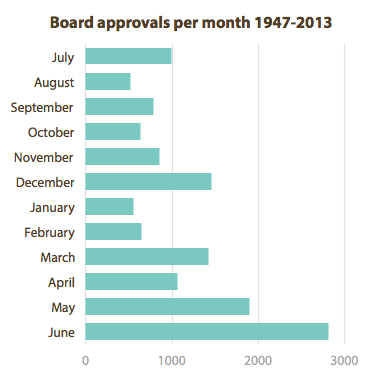
World Bank projects approved by month. Is it just because it’s better to start projects in June? From http://www.chezvoila.com/blog/datadive2
Publications also must deal with time scale mismatch. The original research for the Interactive Community Mapping chapter started about 3 years ago. And the research was excellent, but the conclusions were drawn at that point in the past. Choose another arbitrary point in time, and you get another conclusion. In Kibera, the gap between “need for information” and “government engagement” has closed substantially, and there’s a different story in the balance of “results” and “process oriented” methodologies. Map Kibera Trust has successfully undertaken both modes repeatedly, in many places, engaging community and delivering specific results for a number of partners, including government, most excellently in the 2013 election work. This years-long timeline was actually by design! While there wasn’t a solid results-driver to start, the whole approach was pretty new at that point, and the political climate in Kenya very different. Learning was desired and required, and this needed to play out over the years to be effective.
On the other hand, Ramani Tandale has had a lot of promise and interest, but hasn’t reached that potential yet. Specifically, the original “need for information” was driven by the urban sector of the World Bank, to integrate this work into slum upgrading programs (which were excellent actually). But then the Tech Team Lead in that Tanzania office left, and a number of other schemes didn’t materialize. In other words, the convening role of the World Bank did not have real long term consequence for the community. At least not yet. Despite that, we’ve worked to continue the Tandale project and the people of Tandale have shown incredible interest, such as paying for internet out of their own savings group funds! But they have not received the organizational support, despite the starring role Tandale takes in many World Bank presentations, nor yet the continued solid connection to government to respond to needs. Organizational support and this final connection may be the most difficult piece of the puzzle.
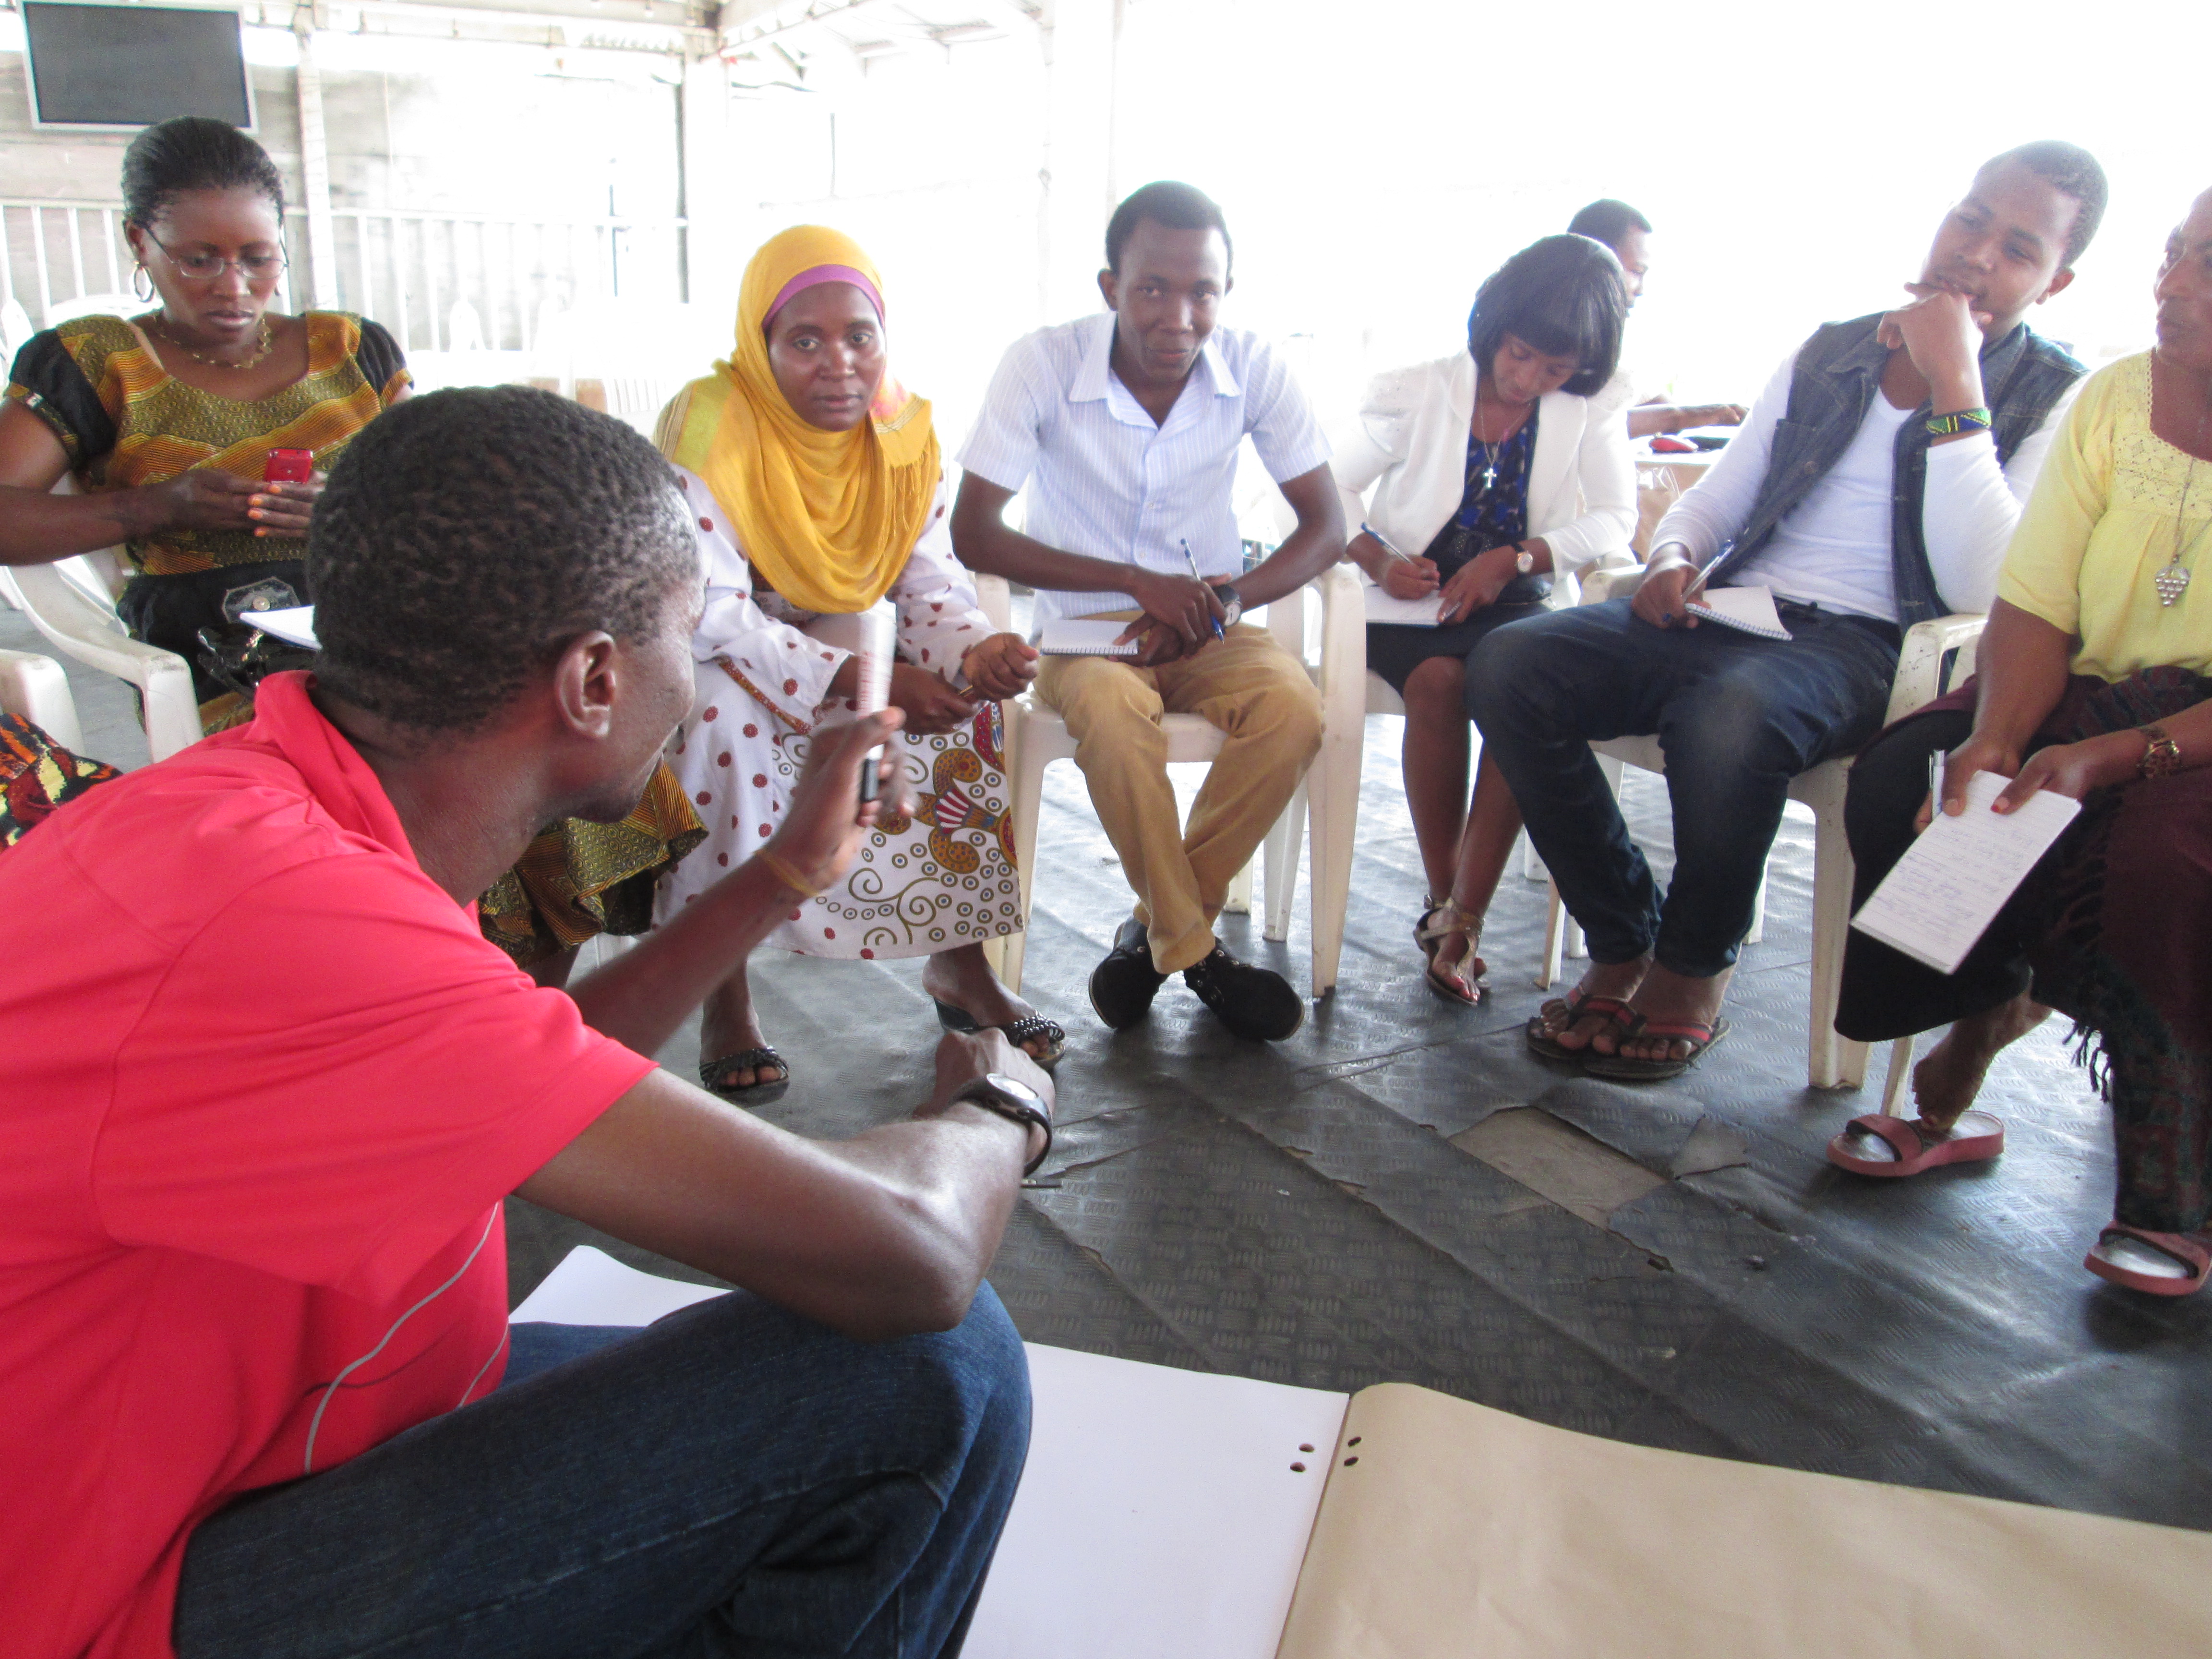
Mapping in Tandale
Incentives are super complicated. All of us need to survive, many of us want to contribute something more. It’s a hard balance, and harder still for someone strugggling economically. Ground Truth has had so many different structures in this way. In Tandale, the university students did actually get a stipend for the “industrial training module”, which was paid out of project funds. That’s standard arrangement apparently. True, it didn’t have much correlation with long term interest … the 2 or 3 strongest folks have stuck with it out of their enthusiasm (though they’ve benefited financially too from their continued engagement). That’s natural. It is worth considering that financial incentive operates at all levels; even government officials in many places expect to receive a “per diem” for taking part in a training, or travelling to a conference (especially from the World Bank!). I don’t think you can simply equate presence or absence of financial reward with motivational success.
But clearly there are other benefits. One of the key benefits, and key distinctions of “Interactive Community Mapping” from participatory mapping of the past, is the connection to a global technical commons like OpenStreetMap. Just like OSM has fundamentally changed GIS into a global network, the same goes for participatory GIS. What this means is that data contributed for one purpose, like community engagement, still exists for special purpose mapping, and vice versa. The commons has its own sustainability, and allows for unintended use … the honest reckoning that we don’t know all the potential applications for these maps, but the option is there. It connects community members directly to a global network of mappers, who can share not only data, but share a data community. What “ICM” and “PGIS” do have in common is an acknowledgement that some places are not even accessible to professionals, or that professionals would do a comparatively worse job then people who know a place.
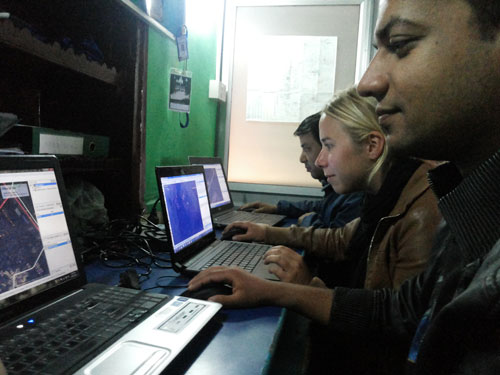
Mappers in Nepal, Mapping for the Philippines. From http://kathmandulivinglabs.org/blog/crisis-in-the-philippineswe-are-with-you/
With a global network structure, new organizational roles are emerging. Some call these infomediaries. There are “local organizations” whose specific mission is to support use of ICT practices in civil society and communities … they work between global technical networks and the needs of local communities. That is what Map Kibera Trust has become. It’s a gap in Tanzania so far. For HOT in Indonesia, there is for all real purposes a “HOT Indonesia” organization, which runs itself and serves this purpose. The groups taking part in GFDRR’s OpenCities fit this role. Many of the groups GroundTruth has worked with (as international ICM “experts”) fit this mold, such as Grassroots Jerusalem and Transparent Chennai. Kenya has a number of these kinds of groups, including Open Data Institute, Mzalendo, Map Kibera, to some extent Ushahidi/iHub, etc.
Some other quick final thoughts, but I think potent ideas for large organizations looking to do community mapping.
With a global network structure, people in large organizations can be directly involved in communities. OpenStreetMap is meant to be easy for anyone to contribute to, and gets easier all the time. Yet, it’s a rare person developing the space for a project inside large organizations that learns to map before designing a project. It’s takes about 30 minutes, and it will make everything a lot more real and easier to talk about.
While we’re at it, can we just stop hedging with “Interactive Community Mapping”, and just talk about OpenStreetMap?! Aside from balloon and kite mapping, which is a different awesome technology, no one is using Google Map Maker seriously for this kind of work. Let’s get on with it and acknowledge, OpenStreetMap is winning, the world needs OpenStreetMap.
And last, asking a favor. Update contracts to reflect open source and open data. The projects I work on are specifically about production for the commons. Yet most contracts still hold intellectual property rights of the work of the contract. This requires further discussion and annexes to standard contracts, every time. I’m sure we can solve this just once.
See you on Thursday!
Media and Conflict in Myanmar, comments from a technologist
Posted: January 27th, 2014 | Author: mikel | Filed under: events, talks | Leave a comment »Last week I was invited to respond at the launch of the US Institute of Peace Media and Conflict in Myanmar Report. It was a humbling honor to share the technologist perspective among such an experienced and learned gathering, and for a really excellent report, recommended reading. Another good recent report, this on the political economy of Myanmar from the Kennedy School is also worth a read if you have interest there. And this short post from OKFN on the challenges of open knowledge in Myanmar quickly touches on many points relevant to ICT.
Transcript of my remarks are below. There were too many other interesting points to capture them all, but here are a few that I noted. Aung Din recommended creation of an independent media monitor, which would simply “name and shame” out of line uses of the media (to promote private interests, or to stoke tensions); sounds substantially more effective and openly democratic than any official government media controlling body. Joshua Haynes asked the question of how donors can coordinate, and support organic, ongoing processes; that’s a relevant question for this field anywhere, but especially so as internationals accelerate exponentially in Myanmar. Others called for journalism training to emphasize digital literacy, and other innovative practices (I’d include GeoJournalism among those). Mobile networks are set to accelerate rapidly (grow from 17% area coverage to 50% in 12-18 months from now) but still, much of the interesting technical community practices are now mechanical rather than informational. Noel Dickover floated the idea of Maker Faire Myanmar, a super idea, if backed by a great local team along the lines of Maker Fair Africa. Finally, was mentioned that this year will be the first census of Myanmar in over 30 years, and population estimates for the country vary from 60-70 million; hopefully this is an opportunity for more open data and transparency in Myanmar.
My remarks…
I’m going to begin with some of my experiences working with tech activists in Myanmar; then share what I think are instructive experiences working with technology and peacebuilding in Kenya, and conclude with a few specific responses to points from the report.
Typhoon Nargis in 2008 devestated Myanmar, and was my first introduction working with technologists there. This was in the very early days of the Humanitarian OpenStreetMap Team. Our volunteer community produces geographic data to support the work of humanitarian disaster responders, which can be seen most recently in the Philippines and Typhoon Haiyan. Timely and accurate maps of affected areas are crucial to coordination of response, they are often incomplete or inaccessible, and that’s where we help. In 2008, we still had not proved this ability, but yet, I connected with technologists in Myanmar who were very eager to see if OpenStreetMap could make a contribution. The biggest hurdle was the limited access to the greater internet; using our services would simply be too slow, even for the small minority of people who had access. So I was completely bowled over to learn that these guys installed their own copy of the OpenStreetMap system on a local server. They could do that because the code is open source, but it was not a simple install by far. The motivation and skill of these guys, working with limited means, greatly impressed me. And I saw that with the right opportunities, the brilliant and eager people of Myanmar could quickly use technology for great benefit.
The next year, I connected with expat activists who were concerned with the Shwe pipeline. Very little information was available publicly at that point. That included the precise route of the pipeline, and especially information on communities directly affected by the infrastructure. We were looking at how to map that route openly, again using OpenStreetMap, and collect sociodemographic data and stories from the ground. There was simply no way to find this kind of data, so our effort stalled. No matter what your opinion on the Shwe pipeline, and natural resource extraction is such a contentious issue economically and environmentally, my feeling was that there should at least be clear and accessible information of the common facts on the ground, and platforms for presenting different views, and now that the pipeline is operating, tools to monitor all aspects of the impact of the pipeline. We can see this happening now. I’m pleased this vision of open data and broad communication on a crucial issue has found root in Myanmar.
You also may have heard about the BarCamp Rangoon events. BarCamps are “un-conferences”, where the schedule is set the morning of the event. Anyone can present anything they want, and people “vote with their feet” to choose what sessions are the most happening. And Rangoon has the largest BarCamps in the world, an astounding 6400 participants this year. I can’t even fathom that scale, especially in the political environment when they began there in 2009. But the tech community of Myanmar made it happen. This speaks to the power of tech and open source culture. The focus of much of the BarCamp is on technical details of computing, and sharing knowledge about skills, economically important skills, and those can often fly under the radar of controversy. But the opening is there for more, in an event style and a culture that expects everyone to contribute, that focuses on understanding the full scope of a problem out in the open, but brings people face to face to talk to each other as human beings, and focus on finding solutions and accomplishing things. For all sorts of conversations, I think we can all learn from the BarCamp model.
Now I haven’t yet made it to Myanmar for a BarCamp, but I’m certain with this opening environment, that’s in my future. A great deal of my work the past few years has been in Kenya, where I founded an organization with slum dwellers in Nairobi called Map Kibera Trust. Slumdwellers have taken the skills of making maps in OpenStreetMap, and citizen reporting with SMS and Ushahidi and video, and used those tools to represent their communities, essentially put themselves on the map. They’ve recently completed a technology and peacebuilding project for the Kenyan election this year, supported by USIP, and I wanted to highlight a few aspects that I think are relevant. This was the first election since the 2007-2008 post election violence. The team mapped ward and constituency boundaries and distributed printed “election maps”, and did citizen, community based reporting on all phases of the election, from voter registration, to primaries, campaigning, and aftermath. While this was all excellent technical work, it was only able to directly impact due to the great amount of work in peacebuilding and networking which Kenya has seen since 2008. Mosts of that happened offline, people directly talking to each other, organizing, deciding to work together for peace. And at the same time, technical communities in Kenya gained stature, particularly projects like Ushahidi, and gathering places like the iHub. Map Kibera was able to link to these peacebuilding networks, and these technical networks, and complement this work. This collective build up of a culture of peace in Kenya, in large part played out in the media.
So some of my responses to the recommended activites of the report should come as no suprise. Mobile technology for early warning and crisis response. Yes absolutely, can only emphasize the potential of this from my experience, and other projects from Kenya like Sisi ni Amani, when part of a broader context. Help people to understand the best social and technical practices. This is poised to be very important as mobile technology spreads rapidly through Myanmar.
On the issue of hate speech in social media, I do not want to minimize these realistic concerns, but from my perspective, I must sound a warning. My inclination when observing efforts to neutralize extremist voices on social media anywhere is, to wonder how any system of control itself would be held accountable. Who is to judge what is acceptable public dialogue and criticism and legitimate dissent, and what is dangerous? Especially in a place emerging from authoritarian rule, the temptation to control must be very high. There have been issues in the past. During the Saffron Revolution, photos of protests were posted to Flickr, and to great worry of people I knew working there, those photos were apparently used by security services to identify individuals. Facebook and Google are private companies, and do have relationships with many governments, and do act on requests, so finding a working relationship with them and others is important. Though as you can see with the NSA revelations, we still haven’t found the proper limits that preserve legitimate privacy and freedom.
However, I do have some ideas of the risks with social media, and what could become explosive, and that’s why I think it’s imperitative to invest in processes of dialogue, both offline and online, and in training in responsible reporting and technology. The initiative for training in journalism is right on. Let me suggest broadening that to non-traditional journalists, to citizen and community journalists, and connect all of that training to open digital culture and technologists.
That is what I imagine the Peace Technology Innovation Workshops can accomplish. Getting people together from different backgrounds, and different skill sets, to talk and work face to face, is excellent. I suggest making these workshops not only talk, not only skills training, but places where things can practically happen. One simple means to do that is through OpenStreetMap mapping parties, where people would produce open data right there. Also, think about such initiatives participating in other ongoing events, and connect to those, like the BarCamps.
And let me conclude with some suggestions I didn’t spot in the report. First, physical innovation spaces have been key to anchoring these kinds of initiatives. In Nairobi, the iHub has been instrumental in providing a neutral meeting ground, where things can happen. Encourage hubs in Myanmar. Second, information security and privacy tools need to be on the agenda, so that journalists and technologists and citizens can be sure they truly have liberty to share their ideas without fear. Finally, embrace the Open movement. Open source software is not only accessible, it’s modifiable for new purposes. Promote open data initiatives, both from data held by the government, and data created by citizens. And apply these both to open exploration. There are so many areas where media and technology can have impact in Myanmar, for urban issues, the environment, a responsible tourist industry, health, education, cultural preservation, and many other things that no one has even thought of yet. Let’s help Myanmar to embarce open culture.
Thanks very much.
More Riotous Open Data Possibilities of Kerala
Posted: February 4th, 2013 | Author: mikel | Filed under: India | 1 Comment »Theyyam is a religious ceremony of Kerala (from Nila northwards, not in Chalakudy) performed annually and uniquely in hundreds, maybe thousands of temples (see note from Prakash in the comments clarifying..). A kind of possession takes place, the deity inhabits the performer of the Theyyam, through dancing, procession, drumming, fire, psychotropic altered states, elaborate costumes, sometimes sacrifice, all eventually bringing direct blessings, fortune telling, and satisfaction to the place and people in attendance. Superficially, there are similarities in style to other arts of Kerala, like the more refined and somewhat better known art of Kathakali, as well as Mudiyett, recognized by UNESCO as a more ancient source folk practice. We visited the master of Mudiyett, watched his evening instruction of local kids in drumming, and while fascinating, it’s hard in that brief exposure to understand how all these folk art forms fit together and relate to each other. So that’s just one place where I see open platforms for responsible tourism deepening visitors’ experiences by having communities themselves document and share knowledge and draw connections and tell the stories.

Kaleidoscopic Catholic Church in Kerala
Kerala has 75 kinds of bananas, and 75 lakh variations of culture. While we were in Chalakudy, an annual pilgrimage season to a local diety was starting, an intense Hindu bachelor God, which inspired a “temporary temple” in Chalakudy itself (no, I asked, it’s not burned like the Temple at Burning Man). People of different faiths are welcome to celebrate each others festivals, and whether Christian, Hindu or Muslim, the folk festivals all have a similar Kerala feel. There’s blending and borrowing: baroque cake-like churches lit up in kaleidoscopic fun fair lights (again fitting in right on the Playa); the oldest mosque in India nearby in Kodungallur has a Hindu-like oil lamp in the most inner place of worship. Theyyam sometimes involves very pre-Brahmin seeming animal sacrifice, and tribal peoples perform snake possession ceremonies. I can only wonder what kind of festivals were held at the oldest Synagogue “site” in India, since that community has all left for Israel (based on a gravestone marked 1264, though the entire community traces back at least til 3rd century AD).

Malayalam Calendar. Open Thayam could be just one simple hack of Open Watersheds.
Prakash is a passionate, obsessive collector of Kerala culture. He diligently seeks out the locations of athaani rest blocks, marking the ancient trade routes. He’s called on frequently as an expert on Thayam, having collected the location and timing of hundreds of ceremonies. And he’s generous with his knowledge. From what is his private word doc, we could potentially iterate and create a simple site openly sharing the location, timing and details of Thayam. Start just with a single site, Leaflet or OpenLayers with a timeline, sharing this data. Iterate to something db-backed to help Prakash and others manage the collection and update the collection into the thousands (complexly, timings vary slightly each year because of the subtly different Malayalam calendar). From culture, to passion, to data, to openness, to open culture.

The Temple 2010 on Burning Man Earth
The vibrancy, the pervasive creative and sacredness of Kerala, where any group of trees can become a sacred grove, reminds me of Burning Man, and I realize the platform for creating, sharing and connecting of Kerala’s river basins could look a bit like the structure of Burning Man Earth: there are camps (or places in Kerala context), art, events, and people; and means to connect, communicate, share media, and pivot around all these. One idea that bounced around BME were tools to create your own schedule (pre-selection) and record your own experience (via automatically linking GPS traces to places and art and events). The work of Blue Yonder for tourists is based in part around developing itineraries, and I could eventually see itinerary functions directly in that responsible tourism platform. Before our arrival to Chalakudy we received an ambitious itinerary (exhaustively including every identified responsible tourism site) and having a map and idea of how much road travel the days would entail would have helped us prepare as tourists and sealed the memories. Of course, we were there to actually help create that map…

Participatory Mapping of Indigenous Names in Taiwan
Open Watershed Data, and a methodology of responsible tourism for river basins, provides a context for these media tools to develop. Design workshops, data fellowships, (even, um, yes, maybe) hackathons, could enable technical and design participation in creating amazing tools for cultures, communities, environments. Kerala has a volunteer spirit, and people want to contribute to “the something greater” when they have the chance. Folks described as “literary people” research local place names, recording the stories and meanings embedded in those names. While in Taiwan, I sat in on a session with an elder of an indigenous group, while he browsed his village in Google Earth, he told stories of (and a dozen students dutifully recorded) the names of every place, indicating deep knowledge of the landscape, how to practice agriculture, what to expect from the weather, commerating the efforts of the past. Indigenous people of Taiwan have gained stature in their society, and they are working to see through the right to return to indigenous names in their communities, yet the big challenges of responding to change remain, including increasing interest from Han Chinese tourists. The struggle is to maintain the integrity of the culture, preserve the culture, as money comes in, avoiding division and degeneration as more opportunities open up. One tribe managed to organize into a tourist cooperative, so home stays and the like don’t compete but cooperate. Many issues are over the land itself. Do individuals in the tribe have the right to sell land to outsiders for agriculture, even if risking overuse and environmental degredation, as it is their land, or is there a collective responsibility in the notion of tribal rights?

The issues of land rights management, cultural preservation all ring true to Kerala, with overlapping jurisdiction of tribal reserves, forest reserves, water bodies, and individual rights. In Kerala, what to say when the people of the river in some desperation, mine the sand in order to make a little money and survive, yet hasten further destruction of the river they depend on. The last remaining sand bank of Chalakudy was saved due to collective effort, as it was adjacent to a religious site. Hence, culture and value are the greatest strengths to seeing long term benefit vs short term individual gain. Perhaps sharing openly, and inviting the real interest of the wider world, can change the trajectory of damanged rivers and lost ways of life.
There is a tremendous wealth in Chalakudy. The crop of this very place, pepper, drove globalization mellenia ago. Roman coins have been found here. Jewish and Christian communities have been here since the 3 century AD. The first mosque and first synagogue in India are here. Colombus was looking for Chalakudy. The Portugeuse built the first European fort on this river. All of this is smartly being invested in by the Kerala government in the Muziris Heritage project. It’s wonderful, and likely to draw many tourists, both international and from India’s growing middle class (the India tourist riotous take of a place like the Athirappalli Waterfall is an experience in itself). But what of the every day history still there today. There are growing numbers of people who want to know more, surely typical and niche, but a crucial part of the tourism “industry”, or maybe better, “culture”. During our last trip to Nila, we impromptly stopped at a matchstick factory. The ruckus of this very basic mechanical operation was transfixing, totally normal to the people working there, who couldn’t understand our interest … but have you ever seen matchsticks made by hand? Social media and the internet are connecting unprecedently, changing relentlessly, challenging (I heard young Kerala guys listening to Gangam Style on their phones). We’re in that moment where perhaps this force of technology can discover and perserve the extraordinary normal of Kerala.