
The case for analyzing 2nd order impact of COVID-19 in settlements in Nairobi
Posted: January 24th, 2021 | Author: Erica Hagen | Filed under: Uncategorized | Tags: C2M2, Covid-19, education | Leave a comment »Nairobi has been the epicenter for Kenya’s Covid-19 outbreak during the global pandemic. In the early days of the pandemic, the Kenyan government imposed a fairly drastic lockdown, including closing in-country travel. This resulted in a massive economic impact. Some trade was allowed to continue, but most individuals were impacted. Schools were also ordered shut.
In September, only testing grades 4, 8, and 12 were reopened. Most schoolteachers in private, informal schools were without pay, or with severely lower pay since schools depend on fees.
Many individuals were forced to quarantine in hotels by the government, at their own expense, if they were found to be exposed or test positive. This also disrupted the economy, as many were providers. Other impacts included increased inter-familial problems, domestic violence and divorce.
Additionally, curfews were put in place and gatherings were limited in size. Many bars and restaurants were forced to close. Tourist dollars dried up. Tourism accounts for 8.8% of GDP, and 8.3% of jobs in Kenya. In slums, police enforced curfews and mask wearing, sometimes violently.
As of January 4, 2021, children returned to public schools. It remains difficult to assess whether the reopening alleviated some, if any, of the losses felt by the community.
Cities Covid Mitigation Mapping Project (C2M2), from the MapGive program at the US Department of State, aims to use information obtained from schools serving those living Nairobi’s slums as proxy in order to understand the second order impact of COVID-10 on the education sector. GroundTruth, as the Nairobi partner, will use resources like OpenStreetMap, Kobo’s cloud database, and Map Kibera’s Open Schools Kenya website, to secure and visualize collected data. This data will also be used to understand how the residents have been responding to the closures as well as changes in sanitation, water access, and job losses. The team will also look at other impacted aspects of life in settlements, especially around water access and hygiene.
Equipped with research teams from Map Kibera, the project will learn how the lockdowns have affected the education sector and share recommendations on how to address these needs in the future. Findings and related data will be made available through OpenStreetMap and other open platforms for easy access by the public and government organizations so they make informed decisions on how to mitigate the second-order impacts of COVID-19.
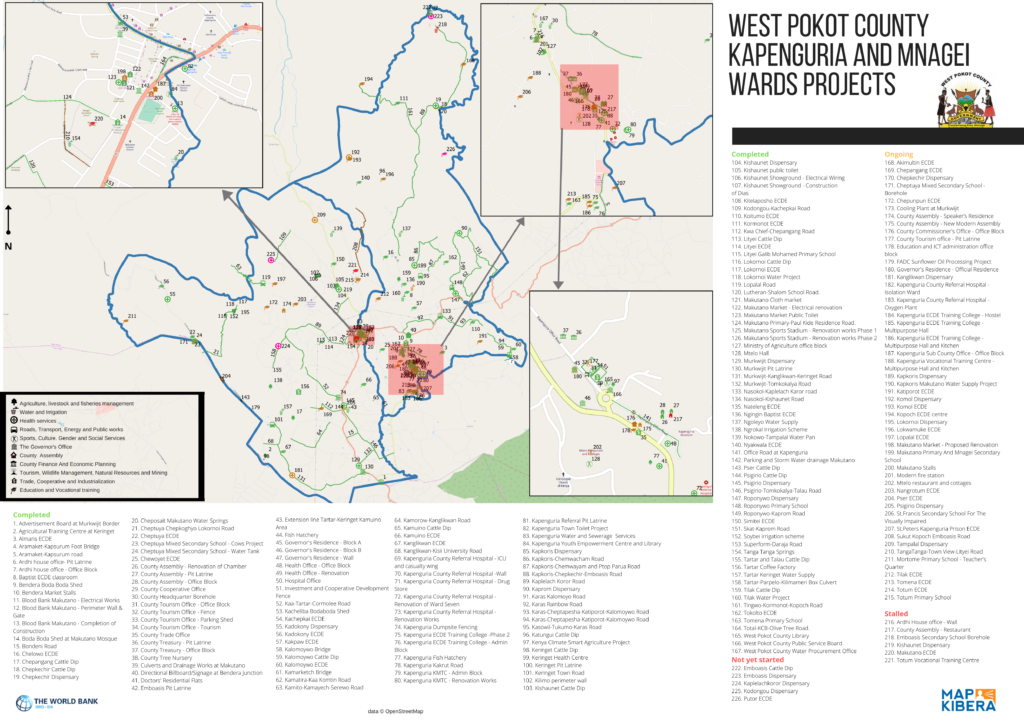
Mapping Participatory Budgeting in Kenya’s Counties
Posted: March 13th, 2020 | Author: Erica Hagen | Filed under: Accountability and Transparency, citizen feedback, Citizen Generated Data, Governance, kenya, openstreetmap, OSM, World Bank | Tags: Citizen Generated Data, Counties, Open Data, Participatory Budgeting | Leave a comment »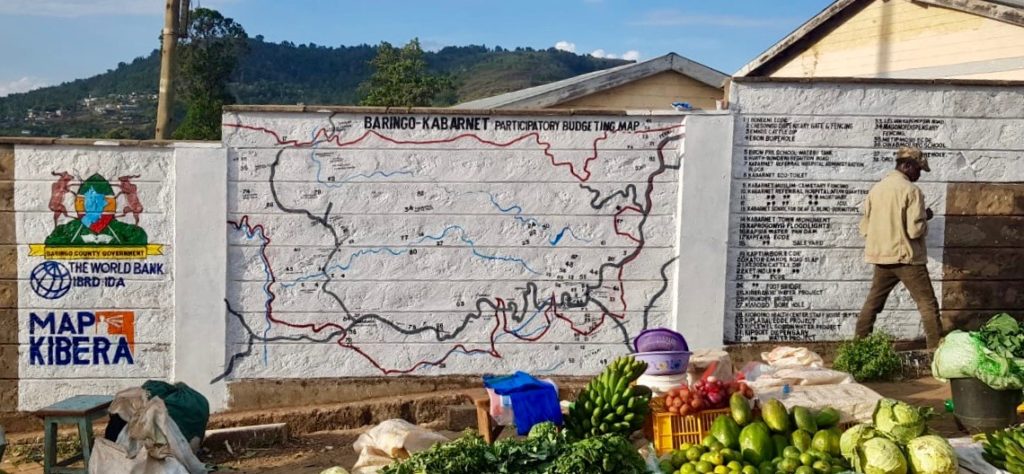
GroundTruth Initiative has been working for the past two years with three county governments in Kenya, along with partners the World Bank and Map Kibera Trust, to map and gather detailed feedback on county-funded projects. By training both county officials and local youth, while working cross-departmentally on data resources, GroundTruth has helped refine a process for citizen engagement which both increases transparency and accountability and provides much needed data and digital maps for the county.
In 2010, Kenya created a new constitution which focused on devolution of power to 47 new counties. Rather than focus development planning and budgets entirely at the national level, or in sub-regions which encompassed vastly different terrain and needs, the new constitution gave power to local officials and governors in the counties. Along with that came a need for new systems for finance and data. Starting up new processes and linking them to national systems was best done through digital means, but not all counties were ready technologically for these requirements.
In 2015, the World Bank began to support select counties to engage their citizens in a process of participatory budgeting. Citizens gathered in each subsection of the county, down to the village level, and prioritized the greatest needs. Budgeted projects included everything from new hospital wings to small dams and footbridges to new water points and classrooms. The process repeated each year, but it was difficult to track progress on the projects and to know where they were located so as to best allocate resources the following year. There were very few up to date digital or print maps showing county projects or pre-existing social resources and features.
GroundTruth Initiative started working with counties in 2017 to help them create such maps. In partnership with Map Kibera Trust, GT worked with Makueni, Baringo, and West Pokot counties to use OpenStreetMap to develop a base map for their counties and map the county’s projects. As part of the process, county officials from Budgeting, M&E, Lands and Planning, ICT, and other departments were trained to use Open Data Kit and the Kobo Toolbox to survey their territory. In order to carry out the process efficiently and increase citizen involvement and project feedback, youth from each ward were also trained. Together, they not only mapped the project locations and basic details by visiting each project, but also photographed them and took notes on their completion status, operational status, and apparent quality.
This feedback was compiled by GroundTruth on a demonstration website for each county. The maps were also developed into print versions which could be used during the PB meetings themselves, and used and shared by officials who are often more comfortable with printed maps.
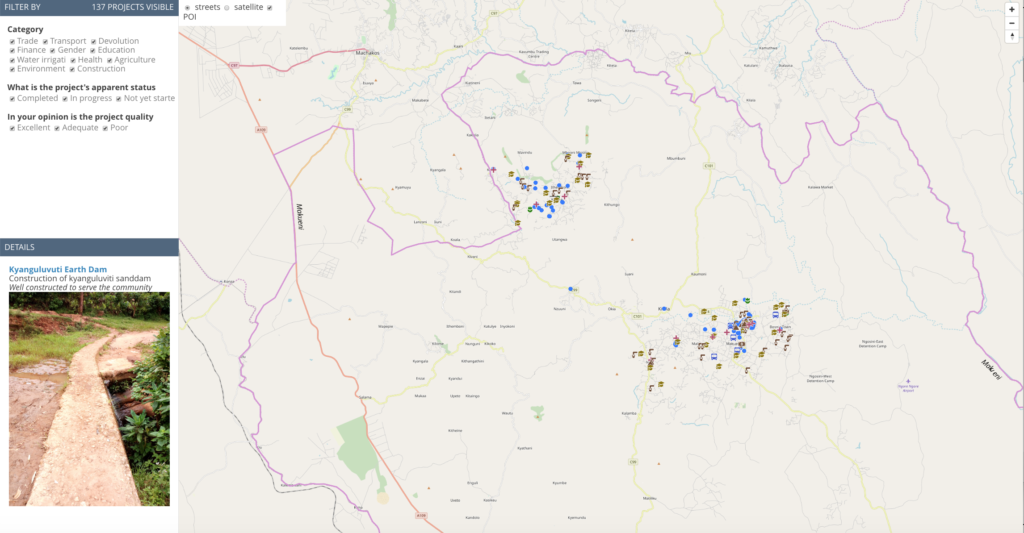
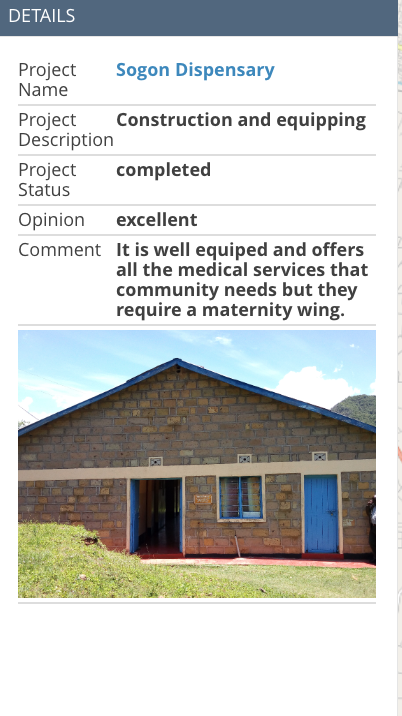
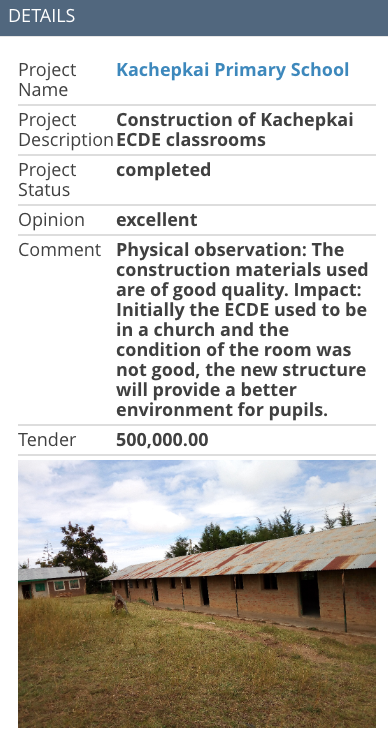
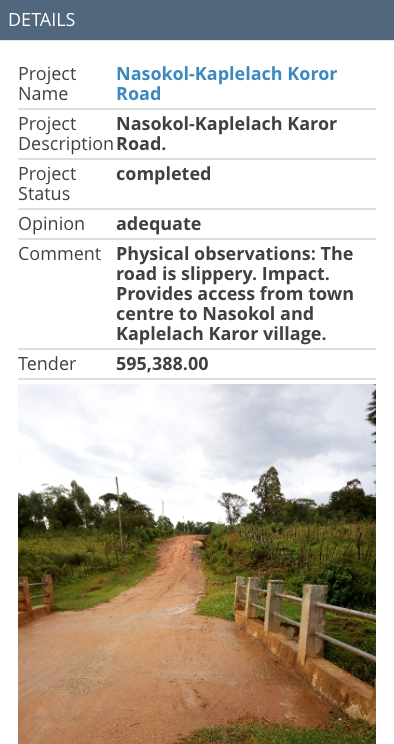
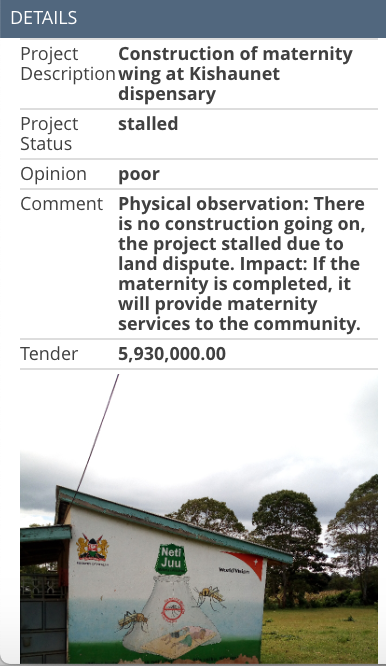
The work has paid off, as some counties have now completed a second phase of the project, receiving additional training on how to execute the process themselves and how to work with the data. All the maps and data stored in OpenStreetMap is open; the feedback on the projects is visible through the linked website. The purpose of the maps is to help the counties and the public to be able to track projects and budget expenditure. In the new phase of work completed in December 2019, budgeted contract amounts are also included on the site.
By working closely with both youth and government Data Fellows, Map Kibera and GroundTruth are currently supporting the counties to continue to utilize the process and better integrate it with their finance, M&E and planning departments, and work with their new GIS officers. Meanwhile, other counties are looking to work with the same process. The future of devolved governance and citizen accountability through mapping looks bright.
New Report Published on Sustainability in OpenStreetMap for Development
Posted: March 10th, 2020 | Author: Erica Hagen | Filed under: Governance, openstreetmap, OSM, Research, Sustainability, World Bank | Tags: openstreetmap, sustainability | Leave a comment »
A new report, written by GroundTruth director Erica Hagen for the World Bank’s GFDRR (Global Facility for Disaster Reduction and Recovery), examines sustainability challenges and strategies for the use of OpenStreetMap in developing countries.
Over the past several years, OpenStreetMap (OSM) has been used by an increasing number of aid and development organizations, like the World Bank’s Open Cities initiative, with the aim of supporting a wide variety of development and humanitarian objectives. OSM mapping has taken place in response to natural disasters (like the Haitian and Nepalese earthquakes), in order to empower slum communities (such as Kibera, in Nairobi), to help mitigate or prevent disease outbreaks (Ebola, and Malaria), or simply to promote the use of open map data among government officials and others already using GIS (for example in Kinshasa, DRC).
However, mapping efforts have frequently run into challenges as mappers and data users try to navigate issues of open data and technology to keep data and maps current and impactful. It can be difficult to keep trained volunteer mappers engaged, build and fund mapping organizations, engage governments productively, develop local management capacity, create successful mapping businesses around OSM, to name just a few.
This research explores the many facets of OSM in development and its “sustainabilityâ€. It examines the definition of sustainability, reviews existing literature about sustainability in ICT4D, and identifies four dimensions of “sustained benefit†which can help us to understand factors that will influence longer-term success. The paper identifies seven different kinds of actors which typically work with OSM in developing economies, and their particular challenges, illustrated by several case study examples.
The report then suggests a way forward for funders, practitioners, and others to move toward greater benefits for all given the constraints of OSM globally, the ethical considerations of digital open mapping, and the challenges of open source and open data projects generally as technology matures.
Sustainability in OpenStreetMap: Building a more stable ecosystem in OSM for Development and Humanitarianism
A white paper prepared for the Open Data for Resilience Initiative, GFDRR Labs, World Bank.
Announcing Release of New Map Kibera Research: Open Mapping from the Ground Up
Posted: October 12th, 2017 | Author: Erica Hagen | Filed under: Accountability and Transparency, OSM, Research | Leave a comment »
Earlier this year, I was fortunate to have the chance to research some of Map Kibera’s work over the past 8 years in the area of citizen accountability and transparency. I was interested especially in whether the maps made in Kibera had had an impact beyond the life of each project, since they were available online on OpenStreetMap and our own website, and distributed offline via paper maps and wall murals. I looked at three sectors we’d worked on —  education, water and sanitation, and security — and interviewed those who had commissioned, been given, or discovered the related maps in some way. I looked particularly at whether citizens had been able to use the maps to improve accountability and governance. This research has now been published as part of the Making All Voices Count Practitioner Research and Learning series.
The results were surprising. I found that maps had been used for a wide variety of purposes which we hadn’t known about before, including arguing for policy changes and reallocating donor resources in Kibera.
The research process involved first trying to track the maps, which was not easy. The Map Kibera team, working with research assistant Adele Manassero, asked around in Kibera, looked on social media, combed through blog posts, and otherwise tried to find out who used our maps and why. Working with open data can be messy this way. We found a number of people who said they had indeed been working with our data. Some were from various NGOs, others were in government. We also followed up on those we’d handed out the map to directly, like school heads and community leaders.
The schools map in particular, which had been the most widely distributed of our maps by far in paper form, had been used for many purposes. It had even been photocopied by the local education official to hand out to visitors. The local Member of Parliament had used it to reach out to the informal schools and create a WhatsApp group to communicate about key school information — Â and to petition Parliament for increased education resources for students in Kibera.
Part of the message here is that by sharing information widely, both digitally and on paper, AND with the backing and network of a trusted local team — Map Kibera — you can make room for impacts beyond a narrow project purpose usually associated with data collection. With all of the emphasis in ICT4D on designing directly for the end user, data collection is usually still done for the end user called the donor — or the organization’s HQ, or governmental higher-ups. Sometimes this data doesn’t even get used. In this case, I found that the better we targeted a variety of local potential “end usersâ€, like leaders of local associations, teachers, and CBOs, the more we saw uptake and impact even without intensive chaperoning of the information. Maps wound up being repurposed. This is the way, I believe, open data is supposed to work.
I suppose then the question is, why did it work this way, when so often it doesn’t? I found that collection and sharing of information by trusted local residents helped lend validity to the information, improve trust and communications between government and citizens, and bring informal sectors into the light in a way that benefitted the community. If anyone wanted to know where the data came from, the folks collecting it were right there, visible, identifiable and relatively unbiased. They could also be called upon to make corrections. Schools indeed have reached out, and recently a lot of updates were made to that data by the team. The analog method of change — being able to call someone, who lives in your neighborhood, and refer to a paper visual — is key to local social impact, even if the information collected is digital.
I’ll be blogging about a number of other things I found interesting out of this research in the weeks to come. Stay tuned!
Looking Back with Making All Voices Count
Posted: May 23rd, 2017 | Author: Erica Hagen | Filed under: kenya, openstreetmap, Research | Tags: Evaluation, Impact, MAVC | Leave a comment »I’ve recently had the opportunity to spend some time learning and thinking about Map Kibera’s work, thanks to a practitioner research grant from Making All Voices Count.
Those who work in the NGO and nonprofit sphere like me might not be surprised to learn that we’ve had precious little opportunity to do evaluation on our work over the past 8 years. So, I welcomed this chance to look into some of the impacts and possibly unintended directions that our work has taken during this time.
While I’ve written about Map Kibera a number of times from the reflective standpoint, I hadn’t had the chance to try to track down some of the specific results. Especially when it comes to who’s using our maps and data, and for what. We have a strong commitment to open data, meaning that you can easily access our information and maps either directly through our website, or through OSM itself. That means it’s hard for us to know who has used them (and if you have, but haven’t been in touch with us to let us about it, please help me out by emailing me!).
I haven’t yet fully analyzed everything I’ve gathered through a series of interviews, focus group discussions, and by reviewing our social media and visitors logs over the years, but a few things have stood out so far. Here is just a sampling:
-
There were a number of cases we were able to track down of data being used without our knowing about it. For open data, that’s a success, right? It means that there have been changes in actual programming for Kibera, especially in targeting interventions to specific geographical areas, finding local partners, and directing donor resources. Information by itself may not produce systemic changes, but could redirect resources in an uncoordinated way to places that most need it. In other words, it can make aid more effective. With some coordination this might be a stronger effect.
-
With some support by intermediaries such as Map Kibera, information like maps can help produce larger systemic shifts. But the level of support required is a question – given that this isn’t typically well resourced. We had some impacts particularly within the education system which were large considering the amount of funding we had, but we couldn’t sustain intensive support. A larger question about the appropriate role of such an intermediary came up again and again.
-
Trust among stakeholders is one major outcome, which has little to do with technology and a lot to do with relationship building. In this sense, information and maps are a kind of tool for getting on the same page, perhaps, or removing some of the bias on either side. There is a lot of mistrust in informal settlements (between citizens and government, citizens and NGOs or CBOs, schools and education officials, etc). This needs to be overcome for improvements in key sectors like education and water/sanitation, two areas I looked into.
-
The value of “being recognized†or being made visible was something that came up repeatedly. A perceived legitimization through transparency. I think there are two things here: being able to speak out or have “voice†in the sense of self-representation; and becoming legible – that is, transparent – which may have more to do with knowing the facts than giving voice to opinions and perspectives.
-
Keeping data up-to-date is a huge challenge. And it can hinder scaling up and expansion because of the effort required.
-
Technology is still a challenge, in that most people don’t use the internet OR may have smartphones but still don’t use them to their full capacity. Offline outreach and printed materials are key, still.
-
Those taking part in our projects over the years have seen a lot of personal benefit, and some of this has been unexpected (on my part). For instance, the value of contests and credentials – winning an online contest for a news story, even an obscure one without any prize, was a huge highlight, as was gaining press credentials or even a simple ID badge to be identified as a member of the organization.
Clearly there is a lot to unpack in each of the points above, and there are many more topics to explore as well! If this is of interest to you, stay tuned for the publication.