Data.Gov and Wikimania
Posted: July 19th, 2012 | Author: mikel | Filed under: events, talks | Leave a comment »
Busy conference week last week with Wikimania and Data.gov.
At Data.gov, gave this presentation, (and video, “Policy Track – Engagement Around Open Data”, around minute 35:00), another variation on the theme of how open community mapping represents a fundamental change to dynamics of development. Keeping with the theme of government open data, this time looked a bit more in depth at how OpenStreetMap and governments interact. Video coming soon.
Impressed with the level of discussion around OpenData. We are steadily moving past the hype (even if we’re still amazed that the Secretary of State gives speeches about Data), and grappling with the real issues of using data … both technically and especially organizationally. Enjoyed sharing the stage with Nathaniel Heller and Steven Davenport for our panel, actually had a really engaging discussion with the audience, maybe due to a combination of Tim Davies skillful facilitation and our unabashed optimistic cynicism. Linda Raftree has a good summation of the emergent themes of the conference. This built on well from the Open Data for Development Camp event back in Nairobi, anniversary of OpenDataKE; iHub research is doing a nice series on the search for real impact in Open Data.
Enjoyed giving this talk at Wikimania (video, slides). Wikipedia is OpenStreetMap’s “big sister”, and we have so much to learn from them. My other experience of Wikimania was in Alexandria back in 2008, which created the opportunity to throw the first mapping party in Egypt (before GPS was legalized!). I took the opportunity to not only go over the familiar ground of OSM, OSM+Gov, OSM in development, but also look at how OSM and Wikipedia communities converge and diverge; Frederik does a more thorough write up of these two communities. Also had the opportunity to learn about the amazing mapping work happening within Wikipedia, including localized maps based on OSM, and the mind-blowing features of WikiMiniAtlas.
Makerere Workshop, Connecting with Service Providers
Posted: July 17th, 2012 | Author: mikel | Filed under: events, uganda | Leave a comment »This post, written in collaboration with Kim Nooij of Fruits of Thought, dives deeper into one corner of the Makere Workshop, which brought “service providers” directly into the mix.
The idea was for teams to rapidly get a sense of the challenges of real life urban problems, brainstorm ways that maps and reporting tools could improve processes, and design a map and process with a close look at real implementation.
Reinier Battenberg facilitated the session, setting the goals, and giving each guest a chance to present their work and challenges
- Umeme Ltd is the biggest energy supplier in Uganda with national coverage (excepting Northwest of Uganda), directly providing power to consumers, downstream of energy producers. This means they take the full force of public frustration when there’s a problem anywhere in the system. They deal with issues like power theft and old decaying power poles, billing complexities, and challenging customer service.
- Makindye Division is one of the 5 divisions in Kampala with approximately 600,000 residents. One main issue is sanitation: cleaning trenches, collecting garbage and emptying public toilets in the informal settlements. Lack of adequate sanitation has led to malaria outbreaks, and citizens have no option but to dump trash clandestinely at night. Structures are constructed at night, encroaching on land set aside for dumping.
- National Water & Sewerage Corporation, providing services nationwide in Uganda, are held responsible clean water, but without clear development plans from Kampala and other cities, it’s unclear where infrastructure investments should be made. They want to connect the 37 informal settlements in Kampala, but don’t know where they are, how many people live there, or what services they already consume. Coordination with other service providers is lacking, yet they’re all interconnected.
- Women in Uganda Network (Wougnet) suports women’s groups, with one focus on the accessibility of health facilities and medical services. It’s often not known what services are in which place, or whether drugs or doctors are available. There’s much to improve in connected the right services to patients.
- Finally, Kepha Ngito. Executive Director of Map Kibera Trust brought out some of the challenges directly facing residents of informal settlements, who have difficulty coordinating and prioritizing needs for the community, and effectively engaging with service providers and authorities.
We broke out into “speed geek” mode, with each service provider rapidly engaging with a 1/5 of the group for 5 minutes, brainstorming possible ways that the tools could address their issues. The first switch raised groans of frustrating at the premature end of good conversations, but the group soon got charged up and rapidly dived into each new setting. The frustration is part of the effectiveness of the technique, brains and mouths start working faster and everyone is eager to share more and dive into more details. Coffee break was really high energy, leading to a second phase of more in depth discussion with only one group. The teams sat together for 45 minutes, to choose a “map” and “process” to design and present back to the group. We gave them four questions to consider:
- How does the process work?
- Who are the stakeholders?
- Who contributes to the map?
- Who uses the map during the process?
For us facilitators, it was fascinating to bounce from one group to the next, sampling the different directions and tenor of discussions. In part due to the personalities of the service provider and students, in part due to the nature of the issue, the discussions ranged from somewhat top-down, to participation among everyone, to even a bit contentious. And that was totally all right, since in practice you’d see this breadth of group dynamics anywhere.
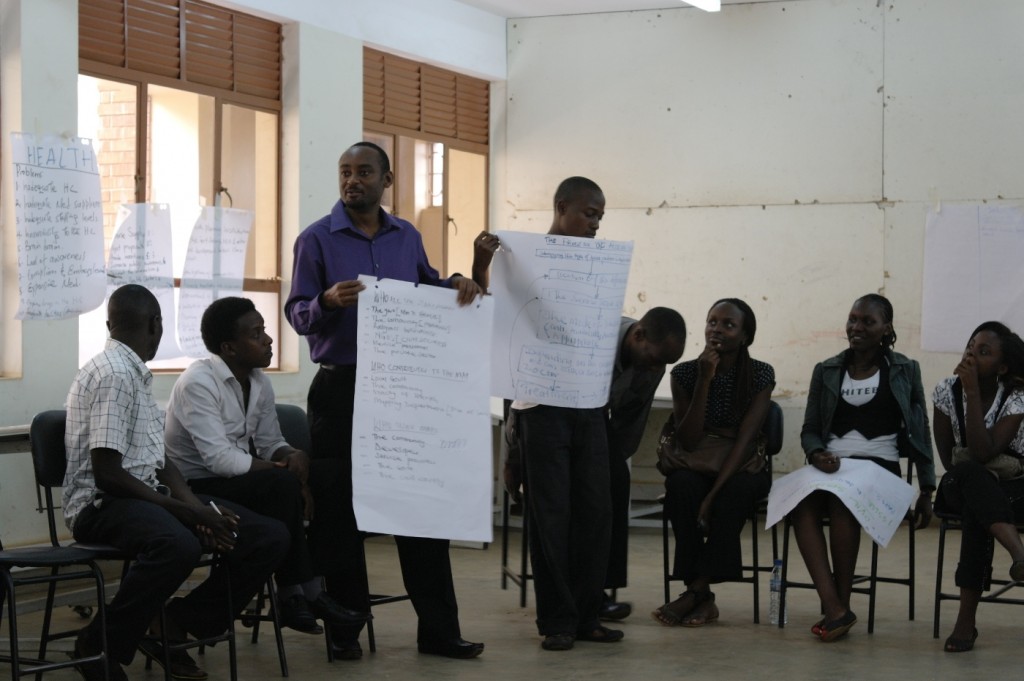
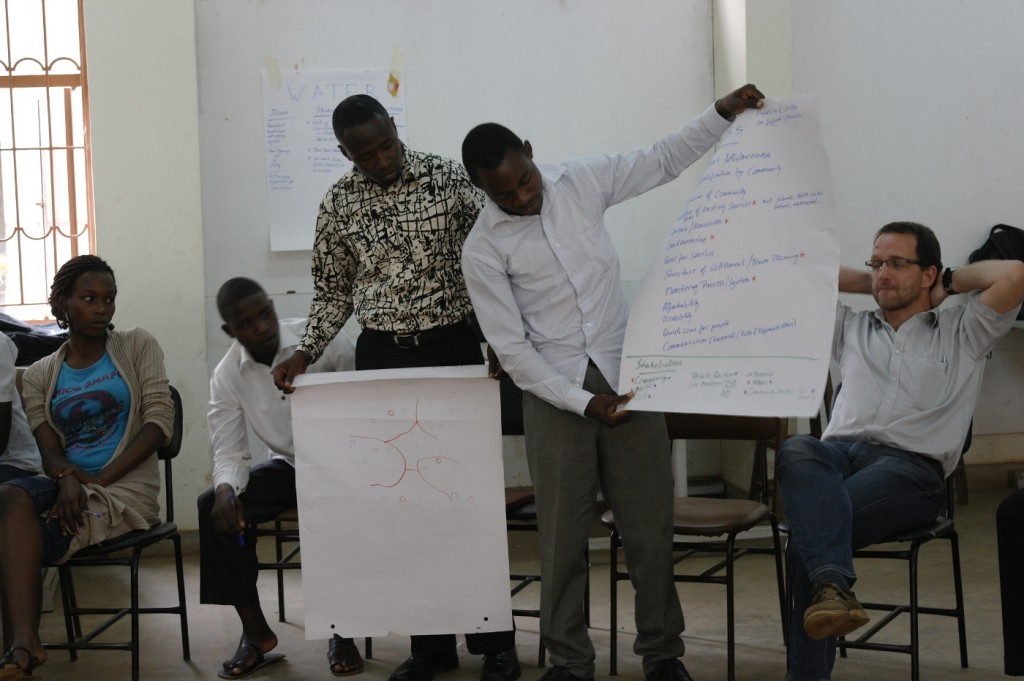
It came time for all the groups to report back.
The Umeme team drafted this detailed workflow of how their customers receive feedback of power issues. Using map data, customers and problems can be located, and along with time estimates can be shared with customers, both on request when customers call in, or pushed out to areas where problems are happening.
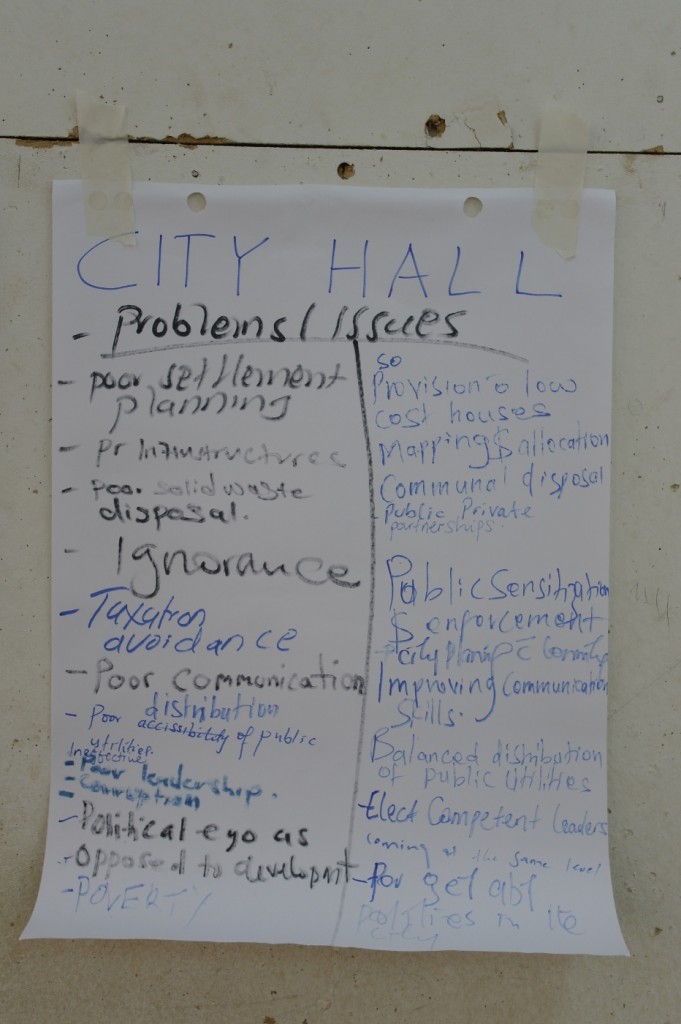
Makindye Division looked at better communication on issues within the community, and more community involvement through partnerships with local organizations and mapping.
National Water & Sewerage covered the challenge of coordination, and how maps and data sharing could lead to more cooperation between service providers.
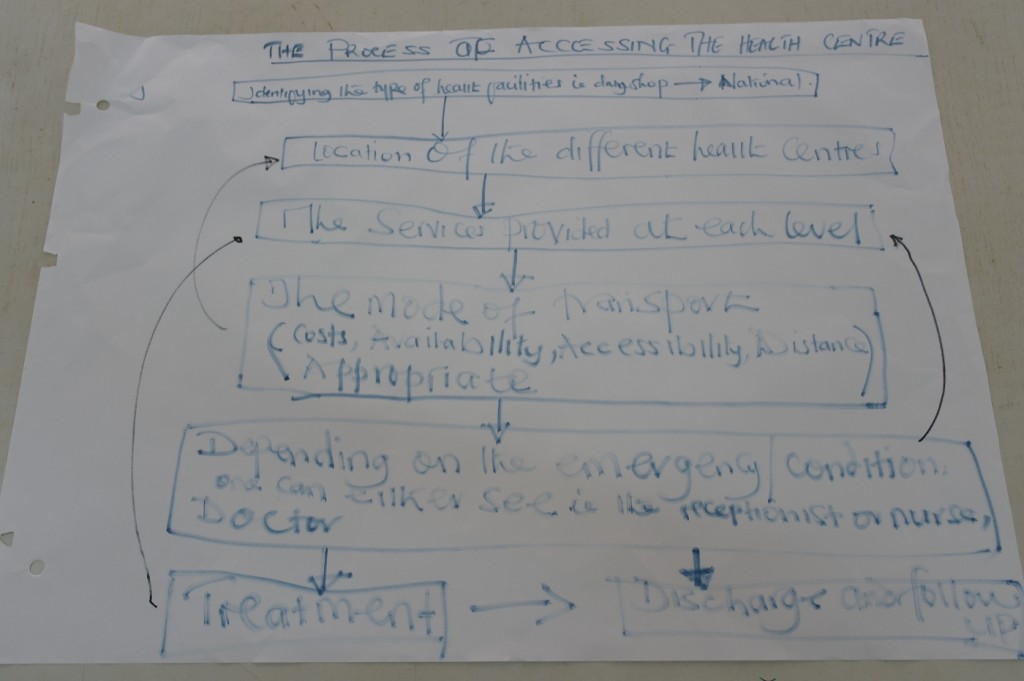
The Wougnet team focused on access to health facilities, and the difficulty of receiving treatment when the only choice is long travel to several health centres to find where the right services are provided. The processes designed looked at increasing public awareness about the supply of drugs and services provided in each center through systems to document stock and locations.
Finally, the Kibera team talked about mapping and reporting tools deployed into the community … sounds familiar.
It was a really engaging morning, and while we didn’t crack the ultimate solution to any of these challenges, I think everyone came away with a better understanding of the challenges these service providers face, and some of the potential ways to address these issues with not only technology like maps and reporting, but consideration for how such tools fit into the entire system.
Sincere thanks to everyone.
From here, we’re hoping that the pieces come together soon for this practical learning to continue at Makerere. More to come.
Community Mapping: Frequently Asked Questions
Posted: July 16th, 2012 | Author: Erica Hagen | Filed under: Uncategorized | 5 Comments »Community Mapping is not a new term, but it seems to be enjoying a makeover due in part to the impact of new citizen-led mapping efforts, like Map Kibera, GroundTruth, and others using OpenStreetMap all over the world. It’s been popping up everywhere lately, so I thought it might be time to look into just what IS community mapping, exactly?
Policy Link reported back in 2002 that:
The terms community mapping and GIS are often used interchangeably. We define community mapping as the entire spectrum of maps created to support social and economic change at the community level, from low-tech, hand-drawn paper maps to high-tech, database driven, internet maps that are dynamic and interactive.
Meanwhile, an organization called Center for Community Mapping uses mostly Google maps to build software and then license it to others to use, with the expressed purpose of “empower(ing) grass-root stakeholders with mapping technology to foster participatory planning, community education, and cooperative organization”.
The first definition above is very broad, and doesn’t say anything about the role of community members themselves; the second does talk about empowerment but does not use open data standards.
Mikel recently presented and posted about this topic, saying “…the excitement of community mapping is beyond the data that’s being created, but the possibility of a fundamental shift in the power dynamics of how development is practiced. If people know the facts about their own lives, they have more power to call to account those institutions which are supposed to serve them, and ultimately, to improve their lives themselves.”
That’s the beginning of our approach. But, to be more explicit, here’s the GroundTruth take…
Frequently Asked Questions about Community Mapping:
Does Community Mapping need to involve the community, in the mapping?
Yes, it does. In the first definition above (the one that equates CM with GIS) it’s more about “mapping of a community” than “community mapping”. To me, that’s just plain mapping. Or perhaps, using GIS to understand a place, which happens to be a particular neighborhood.
Does that community actually have to live in the place where the mapping is happening? Isn’t it enough if they’re from somewhere nearby?
I’d again be pretty strict about that. If it’s called Community Mapping, people should be mapping in their own community, not the one next door. Why? Because we believe this is about participation, and not just about data collection. It’s also about giving people a chance to show what’s happening in their neighborhood from their point of view, in this case through the medium of a map, and about their own use of the information later.
How about if other people map the community and then later involve members of the community in a presentation about the mapping, is that still community mapping?
Not really. It’s just mapping, again, that happens to take place in a community.
Does the community need to own the information collected during the community mapping? Does it have to result in open data?
They don’t need to own it, but we do believe in free and open data as a critical part of community mapping. After all, the point is not to help companies build their commercial base, or to hand over more information to proprietary silos inside NGOs and governments, never to be seen again. The idea is to create a commons of information that can lead to greater transparency from the local level on up, and allow many people to leverage that information.
So, Community Mapping is another way of saying, “the community is actually doing the mapping”. Does that mean they’re using the technical tools themselves? Isn’t that too hard?
In our experience, most people learn quickly to use basic mapping tools, within reason. If students from a nearby university, none of whom live in the community, do the mapping, or if a great local NGO decides to map the local slums, hiring professionals or finding volunteers or using their own staff, none of whom reside in the slums, then that’s not community mapping. If people get their hands on the tools and learn to make the maps (as part of a larger process of participatory planning, information-based advocacy, or other local processes) that’s how we define the CM practice. Yes, we’re going pretty far here in saying that people actually do some technical work rather than perhaps walking around with a more “expert” mapper showing them what is where. There are probably ways that some technical support can be integrated, and certainly not everyone in the community needs to be doing the mapping. But it is part of the premise of OpenStreetMap, that such resources can be created by crowdsourcing, and they make it easy enough to do so.
It’s possible that community mapping can happen without a lot of technical training, though, and using different paper-based integrations (walking papers, etc). Perhaps the key point to make here is, if the goal of your project is explicitly to do community mapping, don’t assume that residents can’t or won’t want to do it themselves. And, as long as your project is done in such a way that prioritizing community empowerment and participation (and check on this carefully; it’s not common), coloring outside the lines of this FAQ is very much encouraged.
If I’m using OpenStreetMap, isn’t that automatically community mapping?
No. It’s great that you are using this user-generated free and open map of the world, though, and thereby contributing to the liberation of data worldwide for generations to come. Please don’t stop. And you might be doing community mapping, but not necessarily.
Is Community Mapping the same as Citizen Mapping?
The name is cleverly different from community mapping. While they could be the same thing, it’s interesting to consider that citizen mapping might imply less of a community-based process, and align more with movements like citizen journalism, imagined to be something done by individuals using their personal mobile devices and things like that. However, in places we’ve worked, that’s not quite how citizen media works either. At this point, I believe the terms can be used interchangeably, and we have definitely used both terms.
Does Community Mapping need to be Open?
I suppose not. But if it’s not, why not? Is it because some of the information collected will endanger a person’s rights in some way, infringing on privacy (household ownership data might)? If not, then yes, it should probably be open. Why? It’s a public good. This might require a fuller debate, but unless the community comes together and decides based on a clear understanding of the implications of free and open vs. private data that they need to restrict access, open should be default.
Does Community Mapping need to involve Citizen/Community Reporting or Media?
It is important to have a well-thought-out means for people that are making maps to use the information and build off of that base. A very effective way to do that is to introduce different kinds of reporting tools. This is because people get excited about their neighborhood and have more to say – the map can’t really finish the job, it’s just the beginning. Also, there’s a story (or several) behind each point of interest. I can imagine there are other ways that people can really engage around what they are seeing and use it, but the point is to go beyond the map somehow and allow people to tell stories with the data. Using something like Ushahidi or basic blogging and citizen journalism to illustrate community perspectives has been exciting in our work – in part because it is not restrictive about what people may want to say about themselves.
Is this the same as Participatory GIS?
Not quite. Participatory methodology should be part of both and PGIS is one of the inspirations for our work; community empowerment is also key to both. Traditionally, though, PGIS is closed and the information gathered in the process not intended to be shared openly (for re-use, etc). Also, that process doesn’t typically impart the technology skills to the participants.
So what exactly IS community mapping? Briefly.
Here’s my shot at the criteria.
1) Community creates/gathers the map data. That is, geographical coordinates alongside any other information (we’ve collected things like number of nurses in the health clinics, all the way to why one mother takes her child all the way to the other side of Kibera to see a doctor and what path she uses to avoid the street thugs).
2) Community also edits the map data themselves, and comes to agreement on the final product.
3) Mapped information is generally shared openly, online, contributing to commons, unless otherwise specified by the community and after a good discussion of the options.
4) Community uses the map afterwards, themselves. This might be the biggest challenge in practice, but there are plenty of people who have been using maps in local development for many years who can support on this point. We recommend introducing storytelling and media around the data through other tools for online expression. The mapping also can be part of a larger participatory development, local planning, or advocacy process.
Is community mapping the easiest/most efficient way to get the map I want?
Not always! In fact, it’s a time-consuming, complicated, logistically challenging, and just plain difficult way of getting a map made. But, getting a truly good map is usually time-consuming and difficult. Don’t forget, it’s the locals who know what and where everything is in the first place. Here you have to distinguish between the tendency to want a quick result, and the actual usefulness of what you want to produce in the long run. The idea with community mapping, when it uses OSM in particular, is that the resulting maps can be easily updated down the road when things inevitably change. You’re investing in creating local skills and a local network of mappers. Of course, you’re also investing in empowering citizens, but even if you just want your map this is a good way to make sure that the map isn’t useless in five years.
You can ask anyone who’s done one of the following things: community organizing, community development, participatory development, for a fuller explanation of the long-term benefits of the process and their challenges. We would place community mapping inside this constellation of methodologies.
But, what’s the point of making the map, if locals all know where everything is? Aren’t maps mostly for government planning or getting from place to place?
Well, not anymore. We think people can influence that planning (or cause it to happen at all) by doing community mapping. And, well, there’s a perhaps less celebrated motivation here for doing this mapping/reporting/making oneself “visible”. It’s been our exciting experience that people really care about having the truth about their lives come out and be heard, seen, verified, in essence validated. Of course, we’re working with communities that are in some way disenfranchised, but so are many others who would want to do community mapping. We started out (with Map Kibera) investigating the interest in, motivation and usefulness of these tools by people in the community, so I’m really looking at what I’ve seen matter to them.
I welcome your feedback and comments, below. Please discuss with us!
Connecting Kampala: Makerere University Mapping and Reporting Workshop
Posted: July 5th, 2012 | Author: mikel | Filed under: events, uganda | 3 Comments »June and the first part of July has had GroundTruth pinging through East Africa … the capitals of Dar es Salaam, Kampala and now Nairobi. We’ve met to help figure out the shape of future projects, held workshops with slum-dwellers students and government-staff, attended conferences, checked in with old friends and probably met hundreds of people. Was so nice to link together the mapping communities throughout the region, and note how each is developing in its unique way. This post focuses on the middle part of the trip, which revolved around a two day mapping and reporting workshop at Makerere University in Kampala.
Our co-conspirators for the week were Fruits of Thought. Douglas, Ketty, Kim and Renier have been holding mapping days over the past year, steadily building OpenStreetMap data and community in Kampala and throughout Uganda. They’re now ramping up for a 5 city mapping tour, supported by Indigo Trust. We were also joined by Mark Iliffe, who’s booming Navy trained voice and experience in mapping (we worked with Mark in Tandale) were key assets for wrangling the workshop group; and Kepha Ngito, executive director of the Map Kibera Trust, bringing the his experience and perspective. The collaboration started pre-arrival, right on the OSM Wiki. Then, we spent a few days camped out on the porch of the Mountbatten ranch, drinking plenty of coffee, and mashing together lots of ideas into what was a successful workshop, and I think a model for future workshops. (Douglas, Ketty and I had the special pleasure of configuring new GPS units, using this guide, which Douglas even updated in parts, and I hope we can integrate into LearnOSM.)
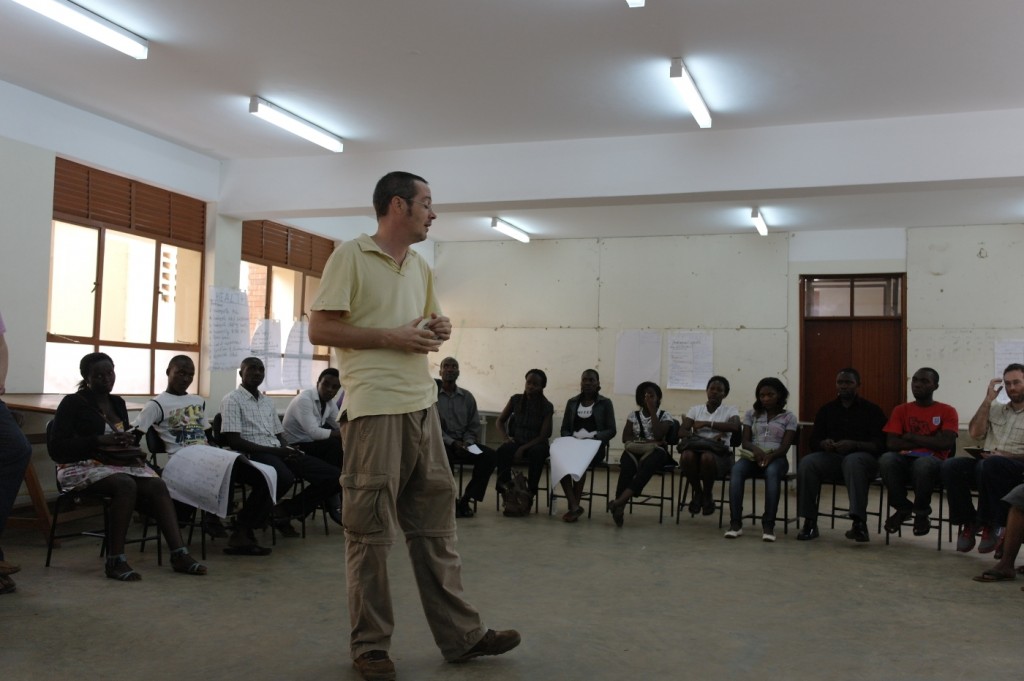
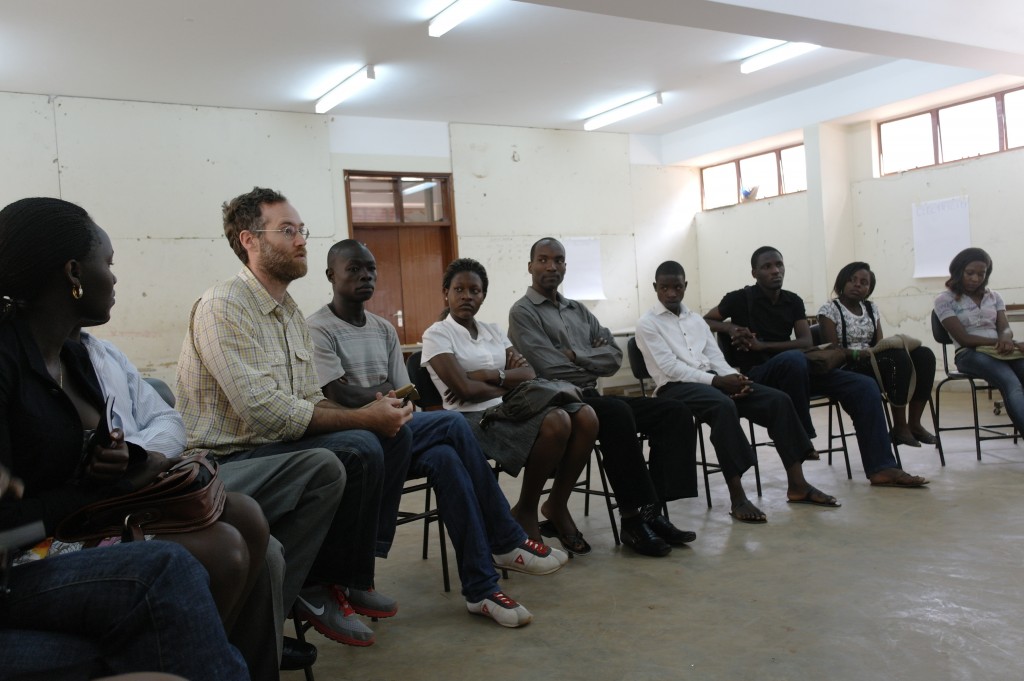
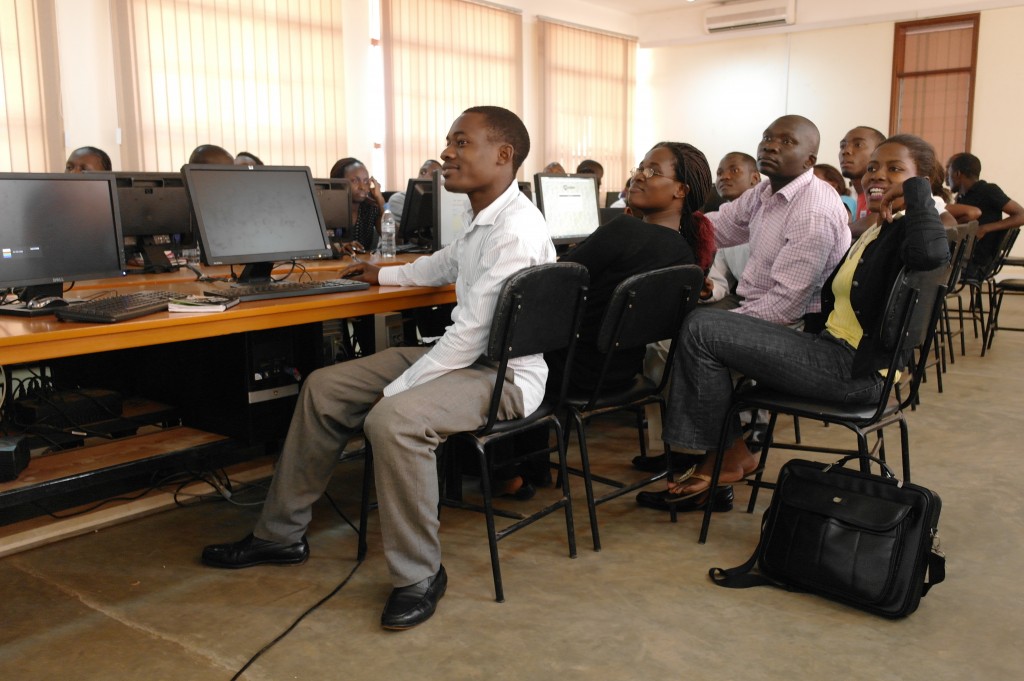
The workshop brought together 20 first year urban planning students from Makerere, eager to gain new skills in real world situations; and 8 staff from the Ministry of Lands, Housing and Urban Development, who are looking to see how community generated information can help inform larger programs. All was held in the remarkably good and spacious facilities at Makerere. More on what shape this all can possibly take hopefully soon, we’re waiting to hear more.
Mapping, you know
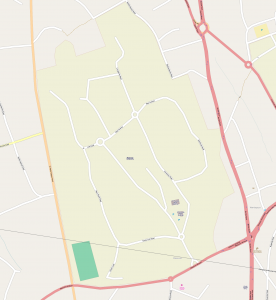
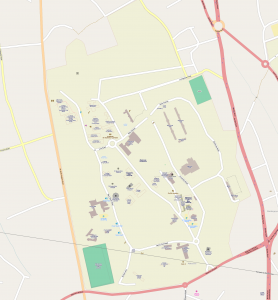
Day 1 was very familiar territory for all of us. The goal was to bring the group through the entire process of OSM, and this went pretty much as well as you could ever expect. Not unexpected that this would be a sharp group. Here’s the before and after.
But before all that, we wanted to set the space, and emphasize this was the participants’s workshop, with their responsibility to guide it themselves in order to get what they want out of it. Took a few tricks from the epic facilitator Gunner, especially from the useful Facilitation Wiki, and threw in some of our own tricks. Of course Opening Circle, with quick 3 part introduction (name, affiliation, mood in one word). And to warm up our voices we went with “What was your first experience with a computer?”, which is always interesting, and in this case clustered around a first experience in high school for the Ugandans (who seemed to have had a nicely equipped education), and a bunch of us who first touched a computer before most of the students were born. To get moving, we “mapped with our feet”, mapping out our home cities by placing ourselves around the room, and then set up mapping groups by bringing together someone each from the SW, SE, NE, NW of Uganda.
All I know is facilitation is hard, and since then I have studied keenly how the events in Nairobi, ODDC and Global Voices, pulled together creative spaces.
Got some good feedback at the end of the first day. We should have emailed out some advance notice of the order of the day and the requirements, and started the discussion of what everyone was hoping to get from the event (yes, read that too late in the Facilitation Wiki). Handouts would be helpful (or at least advance link to LearnOSM). And when we divided the mapping pie, the participants asked for more clear guidance on which areas they should map, because groups ended up overlapping. GroundTruth usually leaves this admittedly confusing step to the participants, because thinking through this and debating with each other is a great way to warm up the geographic collaboration; perhaps we need to think more on how to guide this step better.
Reporting
Day 2 opened with so much, we’re going to cover that in an upcoming guest post by Kim from Fruits of Thought.
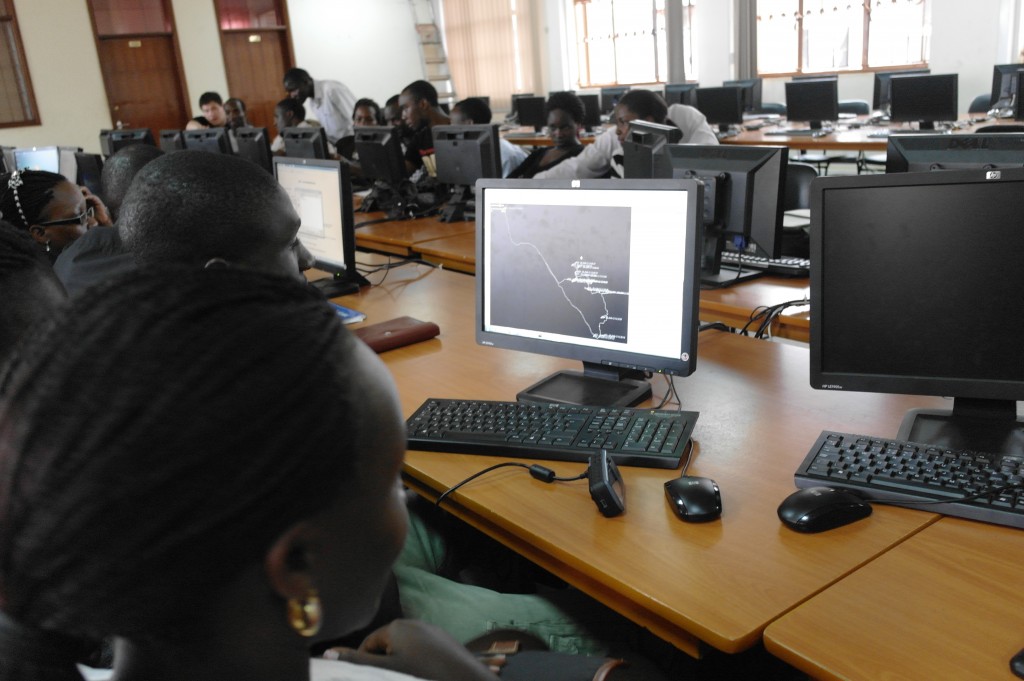
In the afternoon, we dove into reporting. Erica led a discussion on why community reporting is important and the role it plays in engagement, empowerment, and connection; what kinds of things to report; the spectrum of kinds of reports in traditional and social medial; and how to report. For a workshop, one of the easiest ways to get rolling is setting up a Crowdmap instance, Makerere 2012, so we went upstairs into lab for a demo of Ushahidi, and examples from Kenya and Tanzania. The groups that formed yesterday for mapping came together again to produce at least one story on Ushahidi, combining text, images, and the location on the map they created the day before. The focus: their community, the University, and what kinds of things needed attention.
The lab really started buzzing. After an hour after concerted effort, the groups started presenting back their reports.
They were excellent! Just a few are this report on waste management at the University, local culture 🙂, and more…

… including some feedback on the workshop itself! Afternoon Tea Break Missing on Day 2 was an aweseom sly joke but great example of what’s possible with public feedback. The tea break was missing on day 2, and some complained, and photographed the empty tea table, but through the process of reporting learned that it was democratically voted on. Myself, the “service provider”, was able to get in and comment, and encourage them to speak up more in democratic processes! I also learned, even if no one is taking tea enthusiastically (like on day 1), never a good idea to skip the tea!
Food
And on that note, a shout out to the Food Science Kitchen at Makerere, who fed us well over the two days. And a super wow to the Little Donkey, the Kampala based social enterprise serving the best and most suprising Mexican food I’ve had outside of North America. They also house s7 computer school, which hosts regular mapping workshops. Wow. My euphoria was aided by an epic boda boda ride right across Kampala with my life intact.
Open Community Mapping, what we think it is, and what it might be
Posted: May 7th, 2012 | Author: mikel | Filed under: talks | Leave a comment »Last week, I was given the great opportunity to talk at the World Bank about the state of open community mapping, and where it’s heading, at New Tools for Mapping in Disasters and Development. Thanks to GFDRR and InterAction.
…the excitement of community mapping is beyond the data that’s being created, but the possibility of a fundamental shift in the power dynamics of how development is practiced. If people know the facts about their own lives, they have more power to call to account those institutions which are supposed to serve them, and ultimately, to improve their lives themselves.
We are really at such an interesting moment for this approach, with interest and momentum from all sides, both the grassroots and open source communities, and development institutions like the World Bank. What happens next is going to take a lot of quick learning and sharing, exciting.

