What to do with 10 million GPS points?
Posted: October 3rd, 2011 | Author: mikel | Filed under: mics, openstreetmap, swaziland, tech | Leave a comment »10876681 to be exact. Recording once per second over 4+ months, eight GPS units were taken over every road in Swaziland (background on this survey). If not for some mishaps with batteries and missing SD cards, etc, the count would likely be double that.
Under the project description, the guidance had a lot of freedom for working with the GPS data: “Develop simple software demo interface, incl. analytical tools and manual for monitoring fuel consumption in household surveys.”. (In other words, do cool stuff). After some experimentation, we decided to go with three demonstrations: animation of the traces, tiles for use in OpenStreetMap data collection, and fuel consumption estimate plugin in JOSM. All the code is up on GitHub.
Visualization has always been an inspirational tool for data collection and holistic comprehension, especially in OpenStreetMap. Tom’s animation of London GPS tracks in 2005 is still inspirational, and more recently, ITO’s visualization of edits following the Haiti quake. I’ve used party render many times to animate traces during a mapping party, like this one in Mumbai, and experimented with different styles, like at Yuri’s Night.
The challenge here was to make a visualization on such a large number of points. Split up the task into processing and loading the GPX files into a PostGIS database, and then producing frames of an animation from the db. Having the database would also allow production of other products, like tiles. This set of scripts processes directories full of GPX; change the paths depending on your layout.
Thought about experimenting with SpatiaLite or ElasticSearch too, but that will wait for another time. libcinder would be an amazing platform to try, once geo support is in place.
The animation scripts generate a series of images using Mapnik, time slices from the db, and then the frames are assembled using a series of ImageMagick compositions and effects, and then the frames are combined into a movie using ffmpeg.
The result pretty clearly show the progress of each survey team over the months, with Swaziland as a whole emerging by the end. If there had been more time, would have experimented with more dramatic effects, movement of the camera view, music.
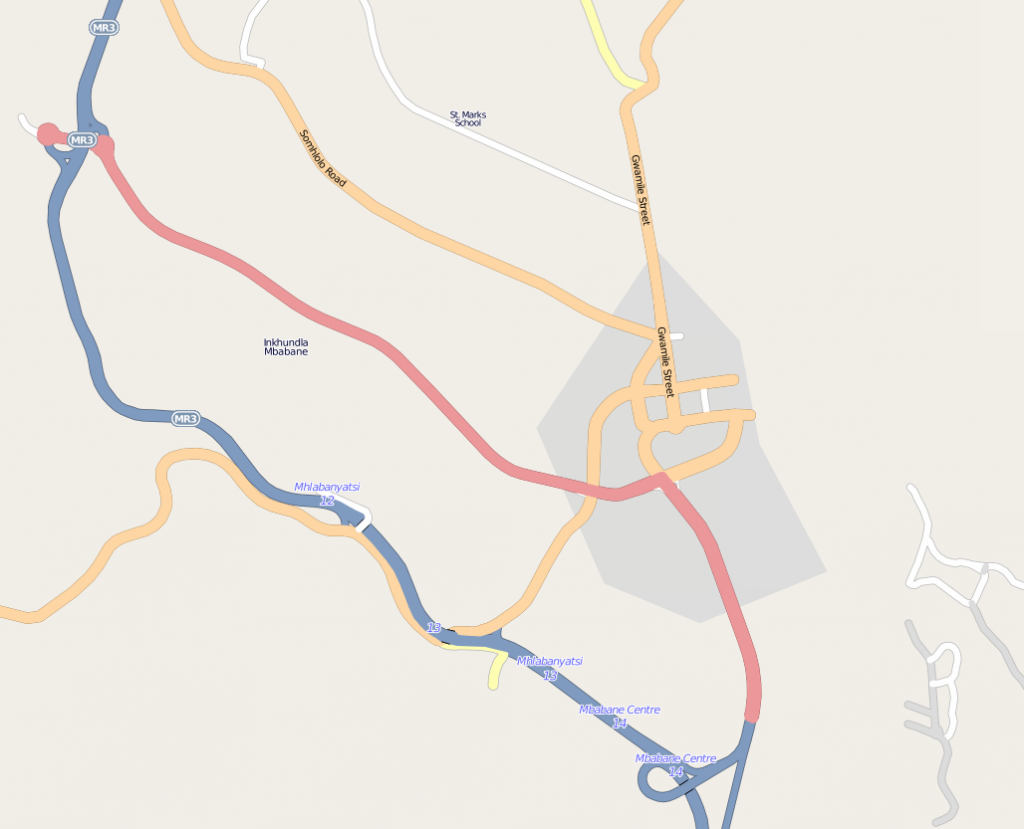
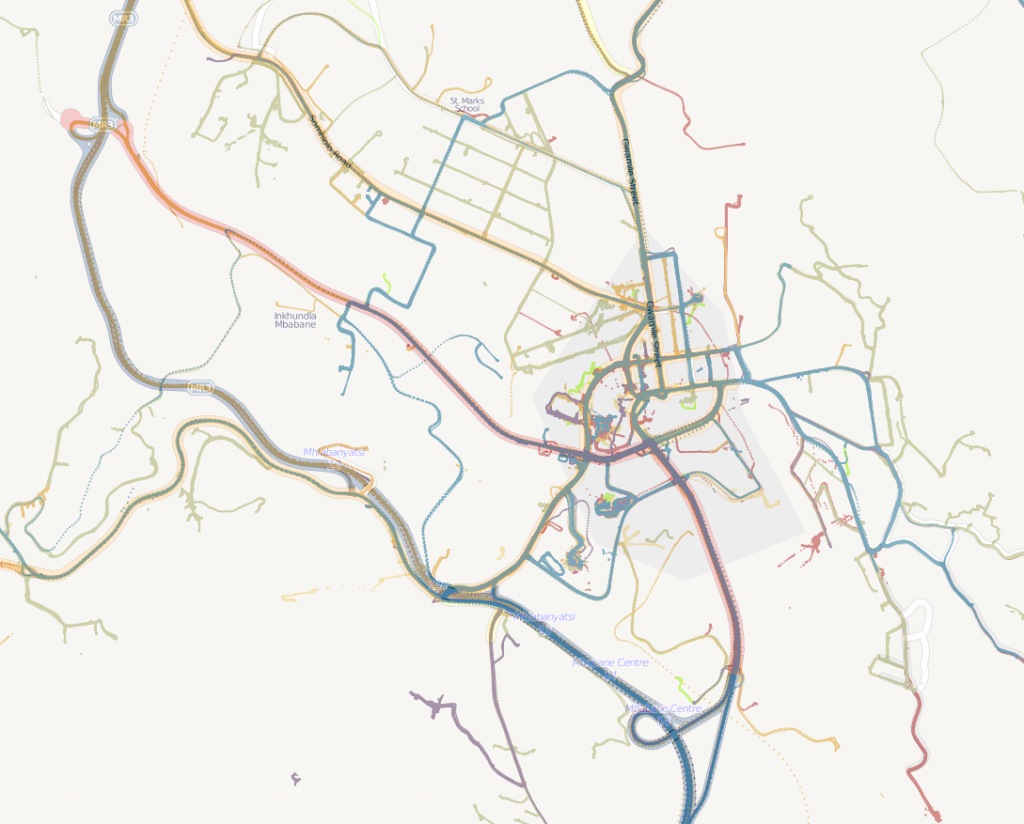
Tiles allow for careful exploration of this large data set. This map has shows all 10 million points rendered together. You can notice that a large number of the GPS traces cover new ground for OSM, so can be used as a tracing source for OSM. Typically in OSM, GPS traces are uploaded/downloaded for tracing, but with the high volume of points, it’s just not practical. The number of points over a particular segment of road gives some sense of its “importance” and “classification” (more used, more likely a major road).The tiles can be configured for use in tracing in Potlatch (http://rockburger.com/mics/tiles/!/!/!.png) and in JOSM (http://rockburger.com/mics/tiles/{zoom}/{x}/{y}.png).
Tiles were again generated using a modified Mapnik script. I experimented with the style and colors using TileMill, by converting a sample of the GPS data into a Shapefile (as of last week, TileMill now has PostGIS support), and converting the carto style sheet into a mapnik config file (carto can just be run on the command line). TileMill doesn’t yet have direct tile output, and I just needed a directory of tile files.
For the gas monitoring application, decided to build it into a JOSM plugin, as it will run on all platforms and should already be part of the MICS GPS toolkit. Started from the ElevationProfile plugin which already generates some stats on GPX files. The modifications add a calculation of fuel usage, based on city and highway fuel consumption rates. The compiled plugin can be downloaded, and then installed in the plugins directory of your JOSM profile; in the Plugins panel of JOSM, simply activate the plugin.
There are lots of ways this can be improved in future applications. ElevationProfile only works on a single GPX file, while this should be adjusted to work on groupings. Additional statistics would be interesting: distance per day, distance average by hour of day, distance average by day of week, distance speed minute by minute; and aligning those stats to points on the map would give some metrics for classification of OSM roads. GPX tracks should have some preprocessing, to simplify and filter out bad readings. Other software to experiment with is Viking an open source, cross platform personal GPS data management tool, and TopCube, which builds desktop apps on node.js apps.
In all this was a lot of fun, opened up some fresh programming avenues for me for dealing with large volume geodata, and should inform further development for MICS.
Household Surveys and OpenStreetMap
Posted: September 29th, 2011 | Author: mikel | Filed under: mics, openstreetmap, swaziland | Leave a comment »Time to introduce our work last year in Swaziland with Unicef, integrating OpenStreetMap techniques into nationwide household surveys.
Way back in 2008, I met Bo Robert Pedersen on the beautiful UN Nairobi compound, to drink coffee and talk maps (without any inkling of what would be happening for in Kenya a year later). Andrew Turner and I were on our way to South Africa for FOSS4G, had scrambled to buy some GPS units a couple days before in NYC (yea 17th St Photo!), and were talking to nearly everyone we could find about maps. We were riding the success of Mapufacture’s acquisition, having a great time mapping in beautiful places, and had found Bo by looking at the most active OSM editors in Nairobi.
Bo just happened to be the regional coordinator for MICS4 (or Multi-Indicator Cluster Survey), an international household survey program coordinated by Unicef, and one of the world’s largest statistical data sources on household demographics and living conditions, and women’s and children’s health and threats to their well-being. These surveys employed GPS units in a fairly simple way, for each survey team to record the central location of survey clusters, and Bo saw an opportunity to make much greater use of GPS. These surveys traverse literally every single road in the country, and simply collecting GPS tracks would unleash a treasure of track points for tracing in OpenStreetMap. And that was simply the tip of the iceberg.
Over the next year and a half, the ideas bubbled, and while in the midst of Map Kibera, we were given an opportunity to pilot these ideas in Swaziland. We designed a pilot project to develop a GPS training program for the MICS survey teams, collect and analyse and trace GPS traces, and explore innovative applications of the tools. Primoz Kovacic and I travelled to Swaziland, developed manuals, and did our best to get the crew psyched for mapping. Traditional household surveys and OpenStreetMap share a lot in common in technique and activity, but differ widely in approach. Surveys are highly controlled, top-down, and jobs, while OSM is self motivated, bottom up, and voluntary, and the interaction between the two was fascinating, especially in comparison to the ongoing work of Map Kibera. One of the first key things was a set of manuals for the MICS program, which are shared here CC-by-SA. The GPS Coordinator Manual may particularly be of wider use, at it describes precisely how to configure Garmin GPS units for surveying with OpenStreetMap.
In the next few blog posts, I’ll present the results, explore the technical experiments with the resulting data, speculate on other applications and approaches, and make available to the OSM community this treasure of data for tracing in the map.
Tandale Highlighted by the World Bank
Posted: August 31st, 2011 | Author: mikel | Filed under: tandale | Leave a comment »Good look at the work of ICT group at the Bank, including our project in Tandale.
“In Dar es Salaam, urban planning students from local Ardhi University are geocoding with assistance from community volunteers. The project is also being facilitated by Ground Truth, —the creators of Map Kibera—and receiving support from Twaweza, a local NGO that focuses on access to information and citizen advocacy around education, health care and clean water.”
And a nice post from our support partner, Twaweza.
And a blog post by Josh Goldstein.
Tanzania: Involving Community Organizations
Posted: August 30th, 2011 | Author: Erica Hagen | Filed under: Uncategorized | Leave a comment »
The first community forum went well. It was deal breaker for the project in the sense that if we didn’t get the community to share our ideals and objectives, making them their own, then the project would fail. Now the map is basically complete for first draft. We have enough of a basemap so we can now support platforms like Ushahidi and enable blogs to be geolocated.
Collecting the data and producing the map, as I’ve previously mentioned is only a first step. The same can be said for involving the students and community members. By creating a small nucleus of highly engaged people, proficient in mapping and storytelling techniques understand the project, they can evangelise the project to others in their community. This ‘infects’ the community from the inside allowing for more people to interact and share the project without ‘outside’ involvement. This will in time hopefully reach a plateau where the entire process of updating the map, reporting and blogging becomes self-sustaining using only the initial equipment and investment.
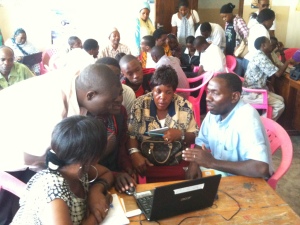
With this in mind, in the build up to the final community forum of the project (where presentations will be made to the community as a whole ie. interested citizens, civil servants and politicians) we gave a ‘pre-release’ talk to ten community based organisations. The format for this was quite simple, the students introduced the map with it’s features and intended functionality and the community members introduced the storytelling elements.
Within this process I spent most of it being a photographer and an observer. It wasn’t quite seeing the monster you created evolve but when presenting both students and the community are owning the process. The community organisations engaged in a Q&A session then participated in reporting using Ushahidi.
During the Q&A many questions dropped out regarding the future of the project and how the map can be used further. Because we are still formulating the future strategy it is difficult to say what the next step will be, but it will be along the lines of franchising to other areas overseen by community, NGO/CBO and Ground Truth, constructing this framework will be taking place for much of the coming week.
We are also printing the map and distributing it. This is key; in using Open Street Map, the collected data is freely available for viewing and data analysis without restrictions like a prohibitive licence. However accessibility to computers and internet understandably is a problem in communities like Tandale. To enable the community to view their map we will be printing A2 maps for placement in the sub-ward offices and printing A4 sub-ward handouts.
By placing it in a communal areas for each of the communities, we aim to reduce the barrier of people using the map by making it accessible. This process has started with our small nucleus of students and community, expanded by involving community based organisations and will be expanded further by integrating the map into governmental offices at the sub-ward level. Having the map built into the fabric of the community from the beginning of the project should make further incremental additions easier.
Community organisations being fully involved in the project is the next step, the process has been started and the ball is rolling. However Eid is coming in the next week, so everything is going pole pole, Swahili for slowly slowly. However tangible results are starting to become very clear, on all levels with all stakeholders.
Originally posted by Mark Illiffe on his blog on August 29, 2011. Mark is working with GroundTruth in Tandale, Dar es Salaam this month introducing community mapping and reporting to Dar es Salaam residents, in a project supported by the World Bank and Twaweza.
Ownership of Community-Reported Problems in Tandale
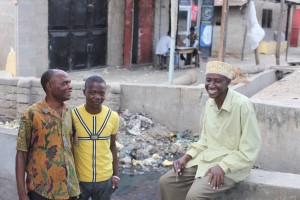
Posted: August 30th, 2011 | Author: Erica Hagen | Filed under: tandale, Tanzania | Tags: Community, Dar es Salaam, ICT4D, mapping, openstreetmap, Tandale, Tanzania, Ushahidi | Leave a comment »The Sokoni Sub-Ward Officer (right) and Community Members
Within the project we have effectively split into two groups along the lines of students and community members. The students are effectively bug hunting, filling in missed tracks and POIs. The community members are focusing on the submission of data into the Ushahidi instance, http://tandale.ramanitanzania.org/ushahidi.
Today was quite special in that the Sokoni sub-ward officer joined one of our community teams, reporting the problems within the community. They engaged fully in the process, finally seeing the problems they had found on the map.
I could feel the sense of achievement from the community members and students. The community members were animated at showing their work to the representatives of the local government, especially those who were on friendly terms with the officials.
Initially I feared that the dynamic of student and community would be one that would be difficult. The students are from Ardhi University and are the best and brightest urban planners that East Africa has the offer (the students come from Zambia, Kenya, Rwanda and Congo). They are on average technology literate and have, with some guidance, become power-users of JOSM and other OSM tools. Understandably the community took time getting to grips with the software and methodology.
We ran a Saturday session, now they are quite proficient with computers, GPS’ and cameras. Closing the gulf the community can help the students and vice-versa. Because we wish for the project to be sustainable the drive must come from the community members, and it has. They’ve really taken ownership of the project. Before they would be querying the OSM Tags, or how to pull tracks and waypoints off a GPS. Now they navigate all tasks with ease.
We start each mapping session at 0900 sharp. To be ready for this time, we arrive at 0830 to set the projector, plug laptops etc. Now I set the projector up, once I’ve handed out the laptops. Nearly all members (community and student) are present, ready and waiting. They, and by extension, Tandale, now own the project.
Originally posted by Mark Illiffe on his blog on August 27, 2011. Mark is working with GroundTruth in Tandale, Dar es Salaam this month introducing community mapping and reporting to Dar es Salaam residents, in a project supported by the World Bank and Twaweza.


